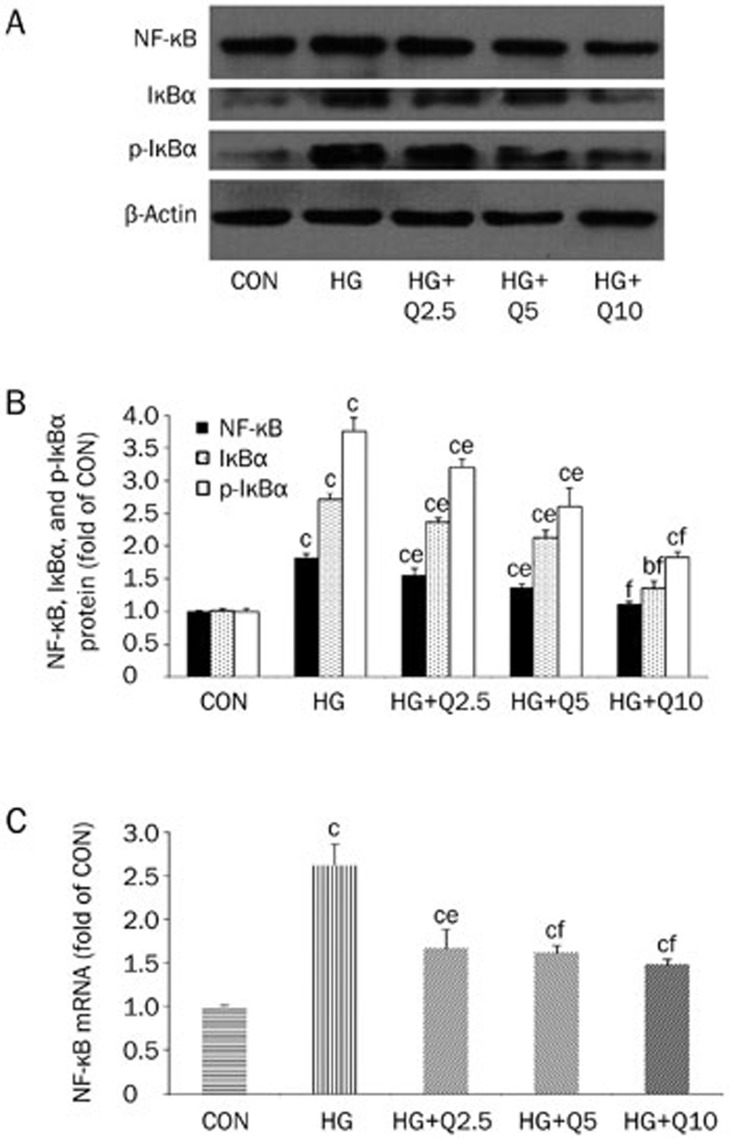
Figure 6.
Relative levels of NF-кB, IкBα, and p-IкBα as determined by RT-PCR and Western blot assays. (A) Representative images of Western blots. (B) Quantitative analysis of NF-кB, IкBα, and p-IкBα protein levels. Protein expression levels of NF-кB, IкBα, and p-IкBα were significantly increased in the HG group compared to the normal glucose exposure control group. Quercetin attenuated the effects of HG on the expressions of NF-кB, IкBα, and p-IкBα. (C) Relative mRNA transcript levels of NF-кB. Quercetin normalized the mRNA levels of NF-кB. Data are the mean±SEM from three independent experiments. bP<0.05, cP<0.01 vs CON. eP<0.05, fP<0.01 vs HG.

