Figure 9.
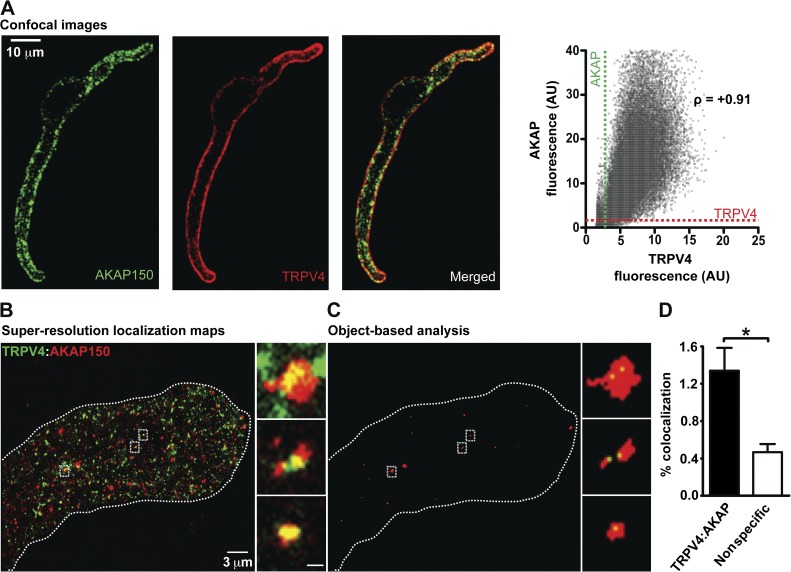
Spatial organization of AKAP150 and TRPV4 channels in arterial myocytes. (A) Confocal immunofluorescence images of AKAP150 and TRPV4 in an arterial myocyte. The image to the right was generated by merging the AKAP150 and TRPV4 images. The graph shows the relationship between TRPV4 and AKAP150-associated fluorescence for each pixel in these images. The broken lines show the thresholds for signal detection in the AKAP150 and TRPV4 channel. The Pearson’s coefficient (ρ) was +0.91. (B) Super-resolution localization map of TRPV4 (green) and AKAP150 (red) in an arterial myocyte. (C) Regions where TRPV4 (green) and AKAP150 (red) colocalized in the super-resolution map in B after object-based colocalization analysis. Insets in B and C are enlarged views of the regions of the cells marked by the rectangles. The broken lines mark the outline of the cell. Inset bar, 200 nm. (D) Percentage of TRPV4 channels showing specific and nonspecific (i.e., random) colocalization within 30 nm of AKAP150. Data are means ± SEM (error bars; *, P < 0.05; n = 4; one-tailed Student’s t test).

