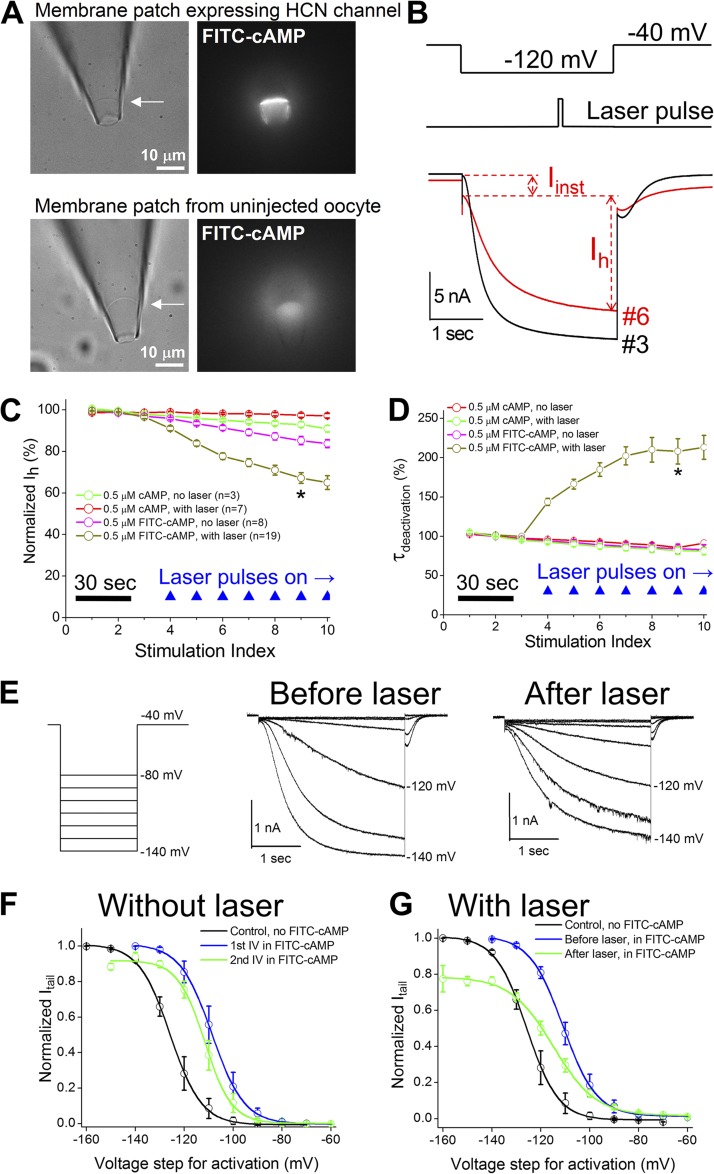
Figure 1.
Effects on Ih current by photodynamic transformation. (A) Bright field (left) and fluorescence (right) images of a membrane patch expressing mHCN2 channels. Bottom pictures show a membrane patch from an uninjected cell. 0.5 µM FITC-cAMP was applied to the bath. (B; top) The voltage protocol for channel activation and the timing of 100-msec laser pulse. (Bottom) Representative current traces before (no. 3 in C) and after the application of laser pulses (nos. 6 and 9 in C). (C) Normalized Ih amplitude versus stimulation index. Voltage step was delivered every 15 s. (D) Normalized time constant of deactivation. *, P < 0.05 in C and D. (E; left) The voltage protocol for collecting I-V curve. (Middle) Current traces before the laser treatment. (Right) Current traces after the laser treatment. (F) I-V curves without laser treatment. The V1/2 values are −126.7 ± 3.2 mV (n = 8; control without cAMP), −109.4 ± 2.6 mV (first I-V in 0.5 µM FITC-cAMP), and −112.5 ± 2.4 mV (second I-V in 0.5 µM FITC-cAMP). The averaged shift in V1/2 is −3.1 ± 1.7 mV (n = 7) and not significant (one-way repeated measures ANOVA). (G) I-V curve with laser treatment. The V1/2 values are −114.6 ± 1.6 mV (I-V in 0.5 µM FITC-cAMP before laser) and −120.4 ± 1.2 mV (I-V in 0.5 µM FITC-cAMP after laser treatments). The averaged shift in V1/2 is −5.8 ± 0.8 mV (n = 6) and significant.

