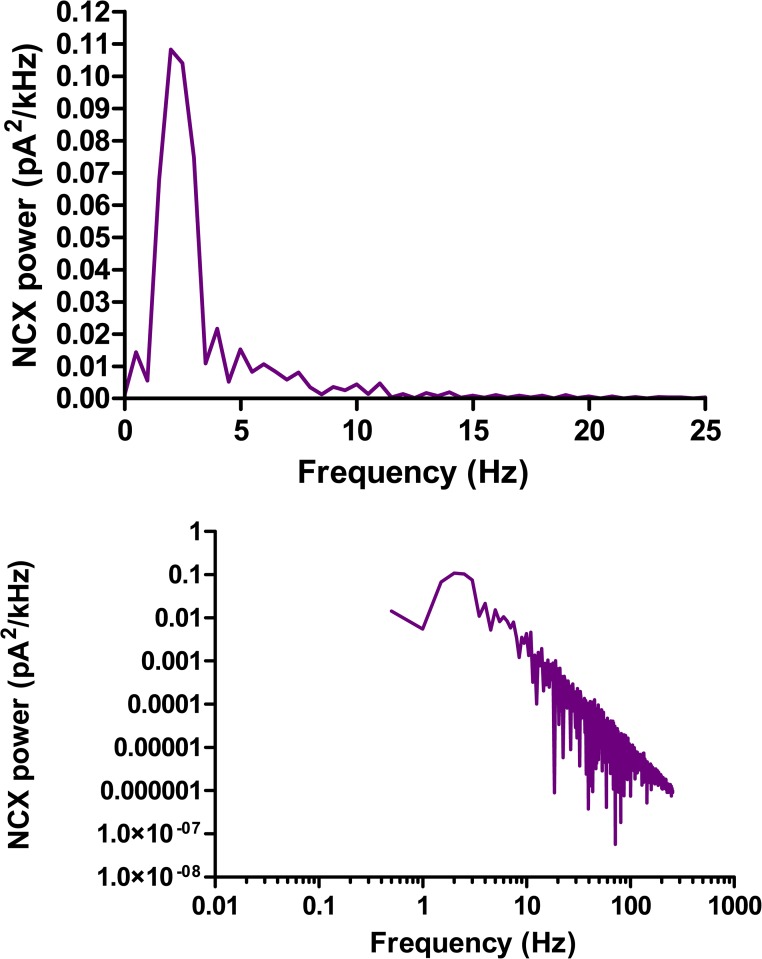
Figure 13.
The power spectrum of the steady-state NCX current generated by the chaotic calcium release shown in Fig. 12. The top shows a distinct peak at 2 Hz. On a log–log scale (bottom), it is seen that there is a tail of high frequency noise with a roughly power-law spectrum.

