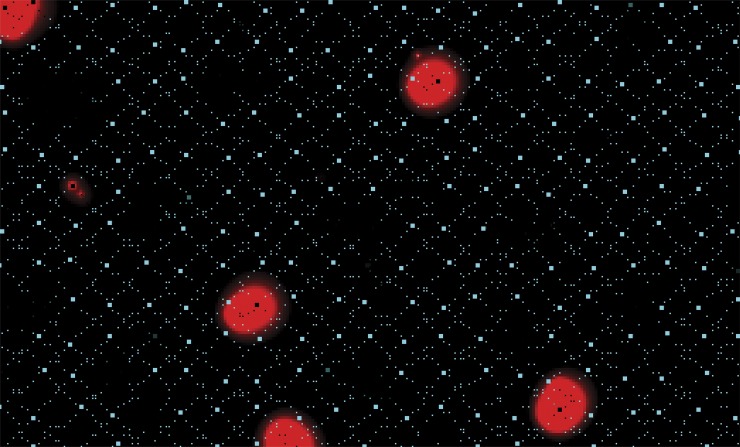
Figure 14.
Cytosolic calcium image (red) of limited-size LCR events produced in the steady state after depolarization to −50 mV. Calcium is shown on an enhanced scale (500 nM saturation, 100 nM black) to demonstrate that the LCR events terminate while still isolated, not by interaction. JSR calcium is shown in cyan.

