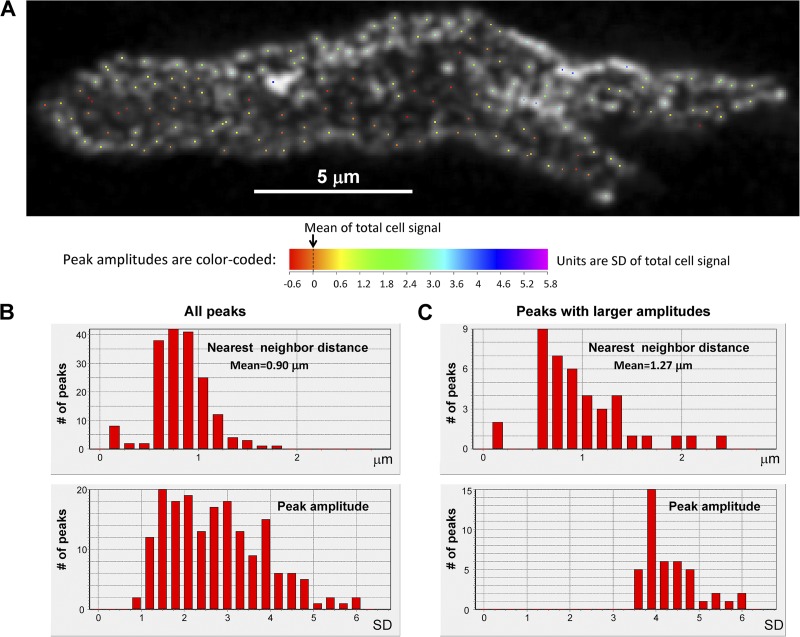
Figure 8.
Quantification of RyR cluster distribution on cell surface. Location of local peaks (A) in the image at Z = 2 µm (i.e., tangential section) by an algorithm described in Results, and histograms of their amplitudes and nearest-neighbor distances. (B and C) High amplitude peaks had separations typically >1 µm, but inclusion of minor peaks introduced submicrometer distances. Full analysis of six cells is presented in Supplement 2.

