
Figure 4.
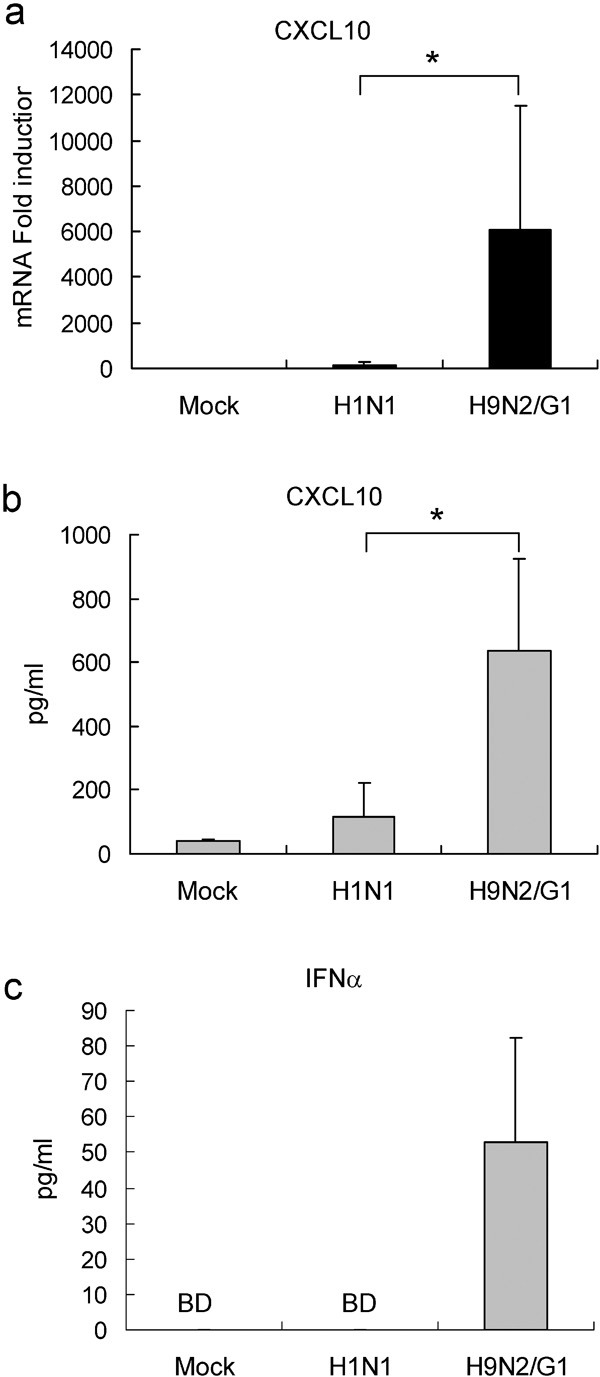
H9N2/G1 induced higher CXCL10 and IFN-α levels than H1N1. Macrophages were either mock-infected or infected with H1N1 or H9N2/G1. (a) At 3 h.p.i., CXCL10 levels were examined by TaqMan gene expression assay; n=6. (b) CXCL10 levels in culture supernatants harvested 8 h.p.i. were measured by ELISA; n=4. (c) IFN-α levels in culture supernatants harvested 8 h.p.i. were measured by ELISA; n=6. *P<0.05. BD, below detection limit; h.p.i., hour post-infection; IFN, interferon.