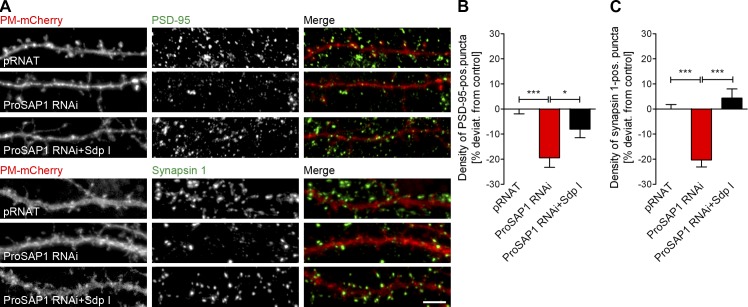
Figure 6.
ProSAP1 RNAi phenocopies syndapin I RNAi in synapse formation. (A) Examples of dendrites of neurons transfected as indicated and stained for PSD-95 or synapsin 1. Bar, 5 µm. (B and C) Quantitative evaluation of the relative density of PSD-95– (B) and synapsin 1–positive puncta (C) in contact with transfected neurons. *, P < 0.05; ***, P < 0.001. Data represent mean ± SEM (error bars).

