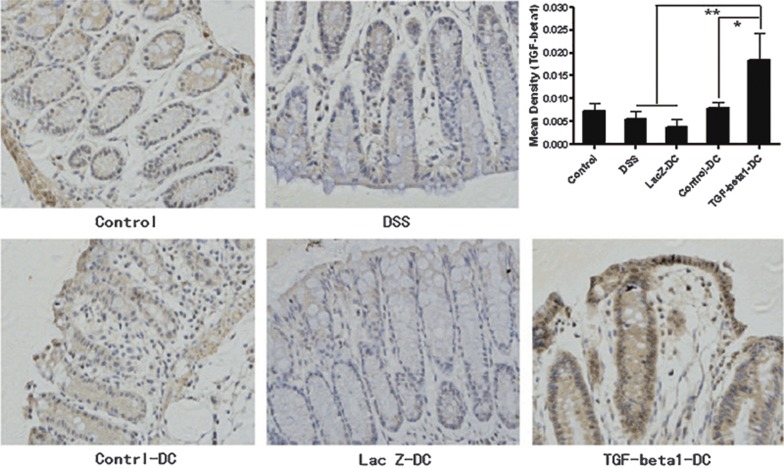
Figure 7.
TGF-β1-DCs can increase the level of TGF-β1 in colon tissues. The figures show the appearance of TGF-β1 via immunohistochemistry at the inflammatory site. The yellow and brown parts in the figures are positive sections, representing the localization of TGF-β1. The immunohistochemical images of the sections were captured under standard conditions. For each section, we captured five visual fields randomly. The photos were analyzed by Image-Pro Plus 5.0. The quantity of cytokine was indicated by mean density. Mean density=integrated optical density/actual area. *P<0.05, **P<0.01; data are representative of three independent experiments (n=5). DC, dendritic cell; TGF-β1, transforming growth factor-β1.

