Figure 3.
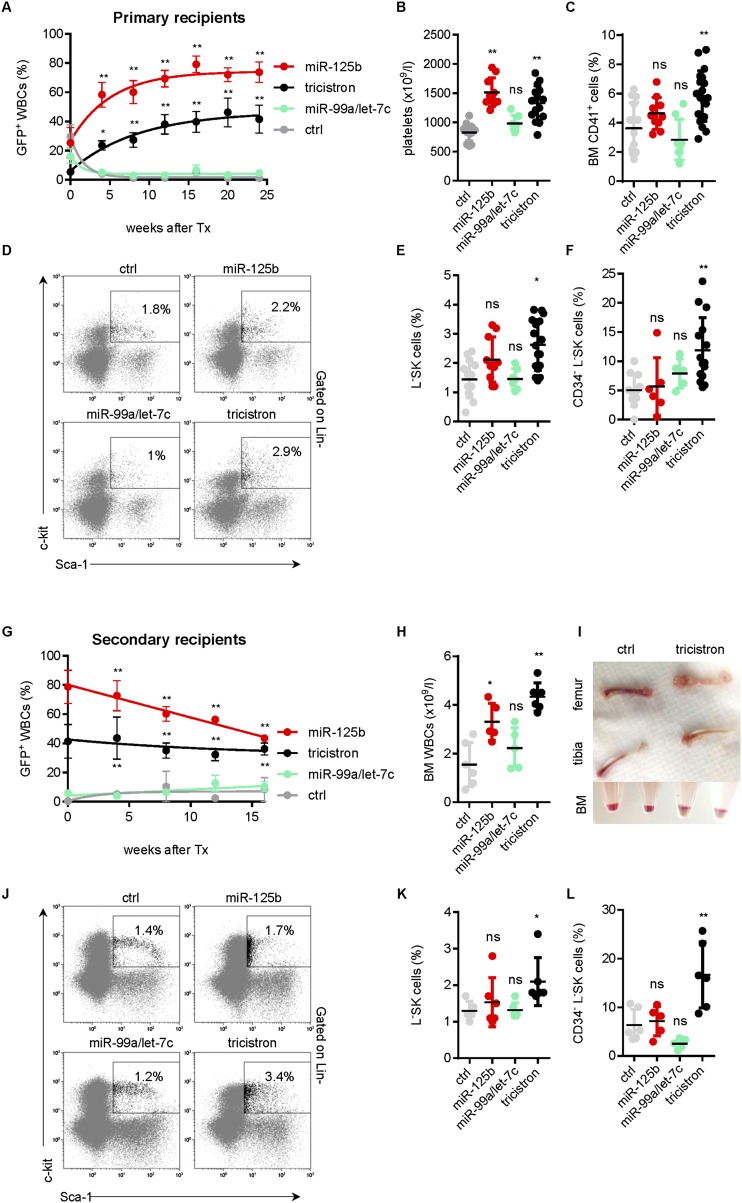
The miR-99a∼125b-2 cluster expands immature hematopoietic progenitors in vivo. (A) Percentage of GFP+ cells in the PB of recipient mice reconstituted with transduced Lin− HSPCs from syngenic donors at the indicated time points (ctrl, n = 14; miR-125b-2, n = 10; miR-99a/let-7c, n = 7; tricistron, n = 17). (B) PB platelets of the same mice as in A measured on week 24 after transplantation. (C) CD41+-expressing cells. (D) Representative flow cytometry plots. (E) Percentage of viable GFP+ LSK cells. (F) CD34− of LSK cells in the BM of the same mice as in A measured on week 24 after transplantation. (G) Percentage of GFP+ cells in the PB of secondary recipient mice reconstituted with transgenic whole BM of primary recipients from A (ctrl, n = 6; miR-125b-2, n = 5; miR-99a/let-7c, n = 5; tricistron, n = 6). (H) WBC counts. (I) Macroscopic images of bones (top panels) and of pellets from flushed BM samples before red blood cell lysis (bottom panel). (J) Representative LSK flow cytometry plots. (K) Percentage of viable GFP+ LSKs. (L) CD34− of LSK cells in the BM of the same mice as in E on week 16 after transplantation. (A,G) Data are presented as mean ± SEM. (B–F,H–L) Values for each mouse are shown. The black horizontal line indicates mean. (A–K) (*) P < 0.05; (**) P < 0.01. (A–L) (tricistron) miR-99a∼125b-2; (ctrl) nonsilencing miRNA.

