Figure 1.
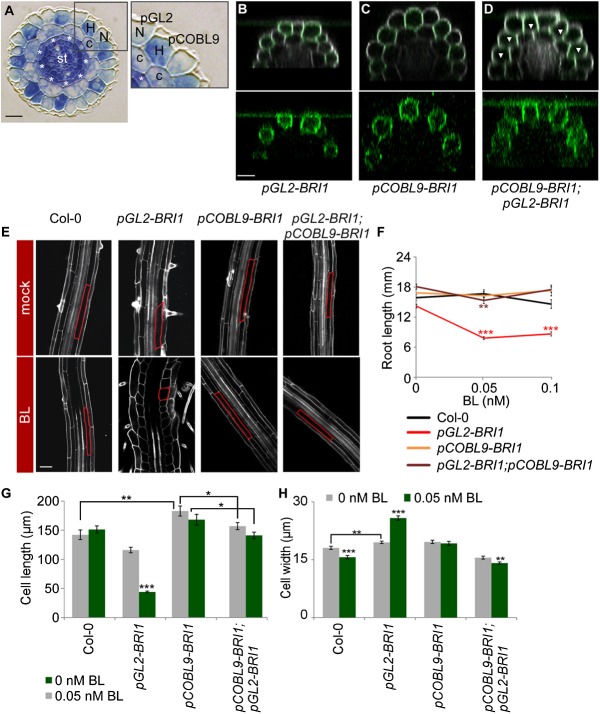
The impact of BRs on root cell elongation is determined by the relative expression of BRI1 in neighboring epidermal cells. (A) Cross-section of the Arabidopsis primary root showing radial organization of its constituent tissues. (N) Nonhair cells; (H) hair cells; (c) cortex; (st) stele. Asterisks mark the endodermis. pGL2 and pCOBL9 promoter fragments mark nonhair and hair cells, respectively. Bar, 10 µm. (B–D) Expression patterns of BRI1-GFP in the different transgenic lines, all in the bri1 mutant background. Note the GFP signal (green, with intensified contrast in the bottom panels) in nonhair cells in pGL2-BRI1 (B), hair cells in pCOBL9-BRI1 (C), and throughout the epidermis of a cross between pCOBL9-BRI1 and pGL2-BRI1 (D). Arrowheads mark hair cells. Cells were stained with propidium iodide (gray). Bar, 20 µm. (E) Confocal microscopy image of these same lines and wild type (Col-0), untreated or treated with BL, with the cortical cell highlighted in red. Bar, 50 µm. (F) pGL2-BRI1 root length is shorter when exposed to low BL concentrations. In contrast, the root length of lines with BRI1 expression and overexpression throughout the epidermal tissue (as in wild type [Col-0] and pGL2-BRI1;pCOBL9-BRI1, respectively) remained similar (mean ± SE; 17 < n < 30). (G,H) Average mature cortical cell length (G) and width (H) in roots of wild-type and transgenic lines untreated or treated with BL (mean ± SE; 26 < n < 95 [G]; 32 < n < 45 [H]). Note the opposing effect of BRI1 on cell elongation upon its high relative expression in hair (pCOBL9-BRI1) versus nonhair (pGL2-BRI1) cells. (*) P < 0.05; (**) P < 0.01; (***) P < 0.001 with two tailed t-test.

