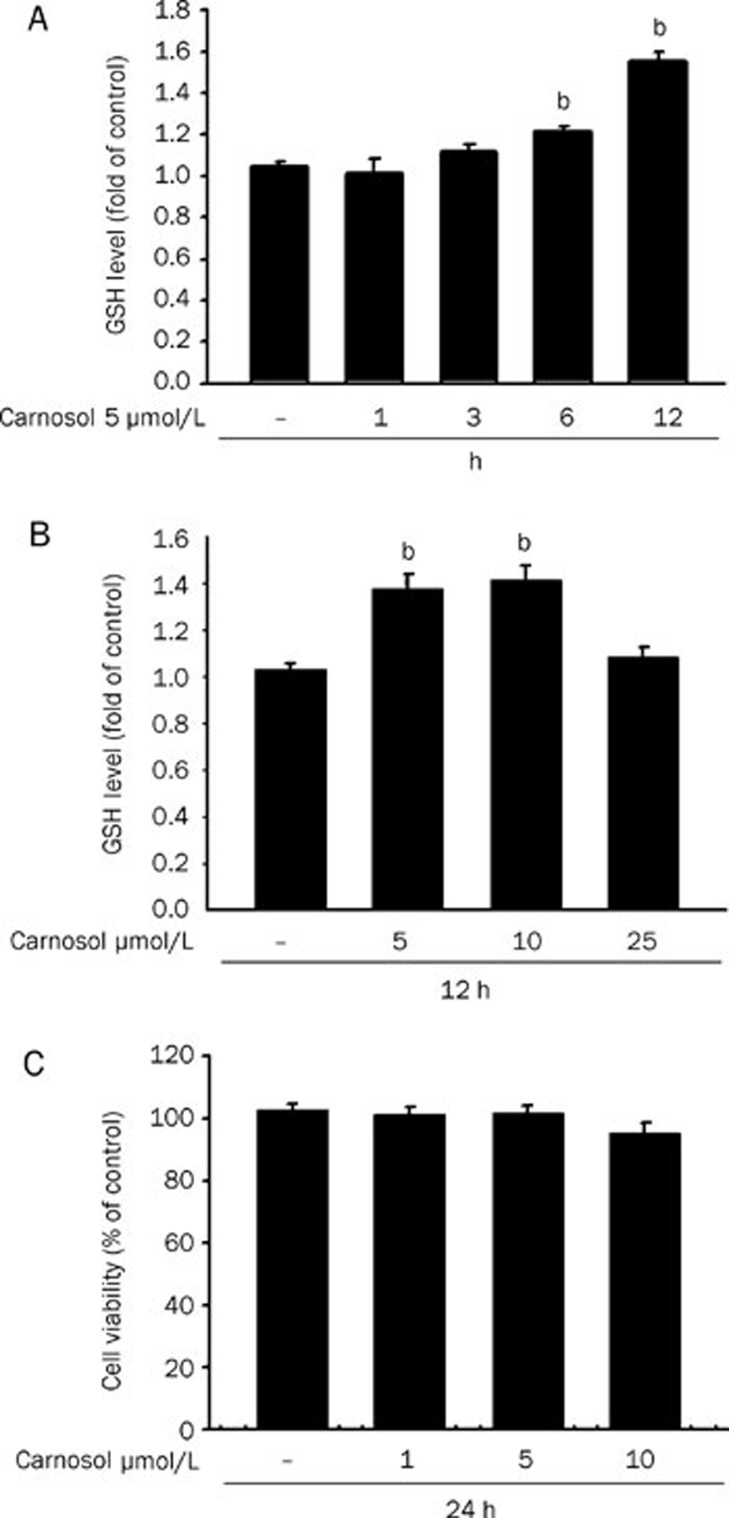
Figure 2.
Increased GSH levels in HepG2 cells treated with carnosol. (A) The intracellular GSH levels of HepG2 cells incubated with 5 μmol/L carnosol for 1, 3, 6, and 12 h. Data values are expressed as a percentage of the untreated control, which was set at 100%. Results are presented as the mean±SEM (n=3). bP<0.05 vs untreated cells. (B) The intracellular GSH levels of HepG2 cells incubated with the indicated doses of carnosol for 12 h. (C) Cells were incubated with the indicated doses of carnosol for 24 h and cell viability was measured. Data are expressed as the mean±SEM of three independent experiments. No significant differences were found by ANOVA.

