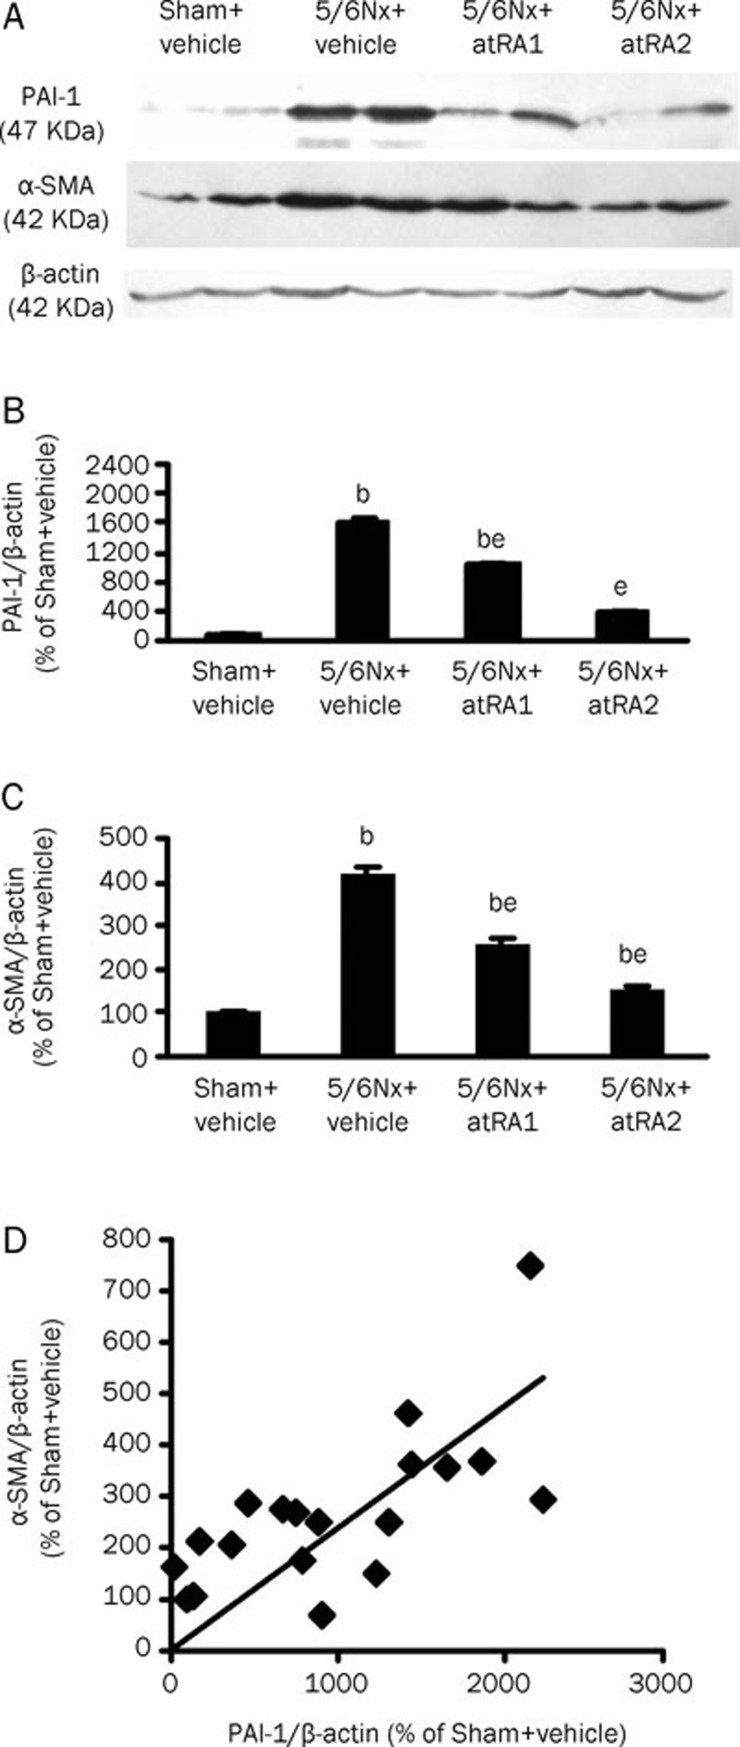
Figure 3.
Western blot analysis of protein expressions for plasminogen activator inhibitor-1 (PAI-1) and α-smooth muscle actin (α-SMA) in the renal cortex. (A) Representative protein bands of PAI-1, α-SMA, and β-actin. (B) PAI-1/β-actin protein ratio according to band density. (C) α-SMA/β-actin protein ratio. The protein ratios of PAI-1/β-actin and α-SMA/β-actin were markedly increased in vehicle-treated rats with 5/6 nephrectomy. These increases were attenuated by atRA treatment in a dose-dependent manner. Values are mean±SEM. n=6. bP<0.05 vs Sham+vehicle; eP<0.05 vs 5/6Nx+vehicle. (D) Correlation between α-SMA and PAI-1 expression (r=0.759, P<0.0001).

