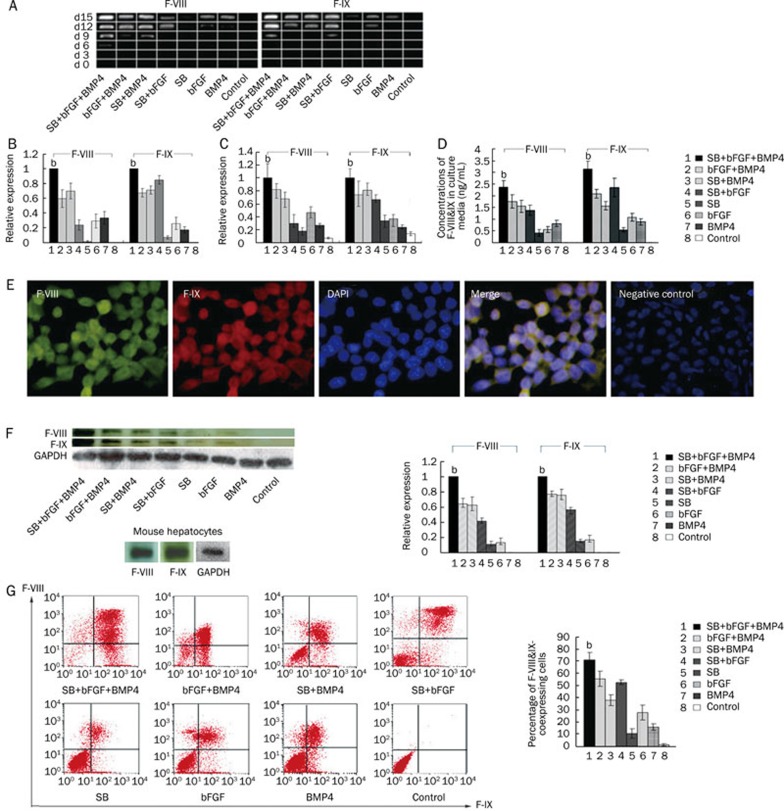
Figure 4.
Expression of F-VIII and F-IX in differentiated embryonic stem cells. (A) Reverse-transcription polymerase chain reaction (RT-PCR) analysis of F-VIII and F-IX gene expression during various stages of the differentiation process. Comparisons among cells treated with different combinations of factors were performed. (B) Comparisons of F-VIII and F-IX gene expression among various cell groups on day 15. The expression of β-actin mRNA was used as a loading control. Histograms represent densitometric analysis corresponding to the mean±SD of three independent experiments. bP<0.05 vs any other group. (C) Real time-PCR analysis of F-VIII and F-IX on day 15. Histograms represent densitometric analysis corresponding to the mean±SD of three independent experiments. bP<0.05 vs any other group. (D) ELISA results showing the protein levels of F-VIII and F-IX secreted into the culture medium. Histograms represent densitometric analysis corresponding to the mean±SD of three independent experiments. bP<0.05 versus any other group. (E) Double immunofluorescence for F-VIII and F-IX was performed on day 15 in cells differentiated with SB+bFGF+BMP4. Cells were stained for F-VIII (green) and F-IX (red). Blue indicates nuclear staining with 4′,6-diamidino-2-phenylindole (DAPI), and merged images are shown. Undifferentiated ES cells were used as negative controls. (F) Western blot of analysis of F-VIII and F-IX on day 15. Expression of glyceraldehyde 3-phosphate dehydrogenase (GAPDH) was used as a loading control. The histogram represents densitometric results from three independent experiments. bP<0.05 vs any other group. Mouse hepatocytes were used as positive controls. (G) Flow cytometry experiments analyzed F-VIII and F-IX double-positive cells. The right upper corner represents F-VIII and F-IX double-positive cells. The histogram shows the percentage of cells coexpressing F-VIII and F-IX on day 15, and a comparison among groups treated with different combinations of factors was performed. All experiments were repeated three times. bP<0.05 vs any other group.

