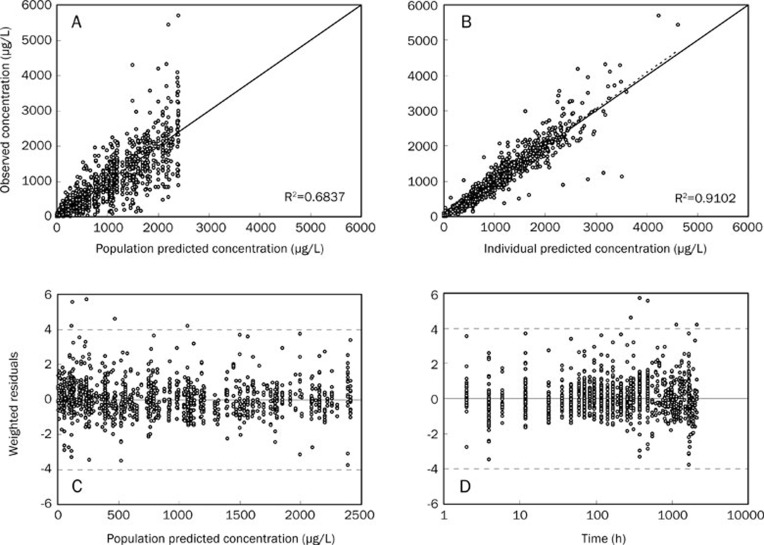
Figure 3.
Final model evaluation plots. (A) Population predicted concentration vs observed concentration. (B) Individual predicted concentration vs observed concentration. (C) Weighted residuals vs population predicted concentration. (D) Sample time vs weighted residuals. The solid line in (A) and (B) represent the line of identity, and those in (C) and (D) represent the line y=0. The dotted lines in (A) and (B) are linear regression line, and those in (C) and (D) are the limit lines y=±4.

