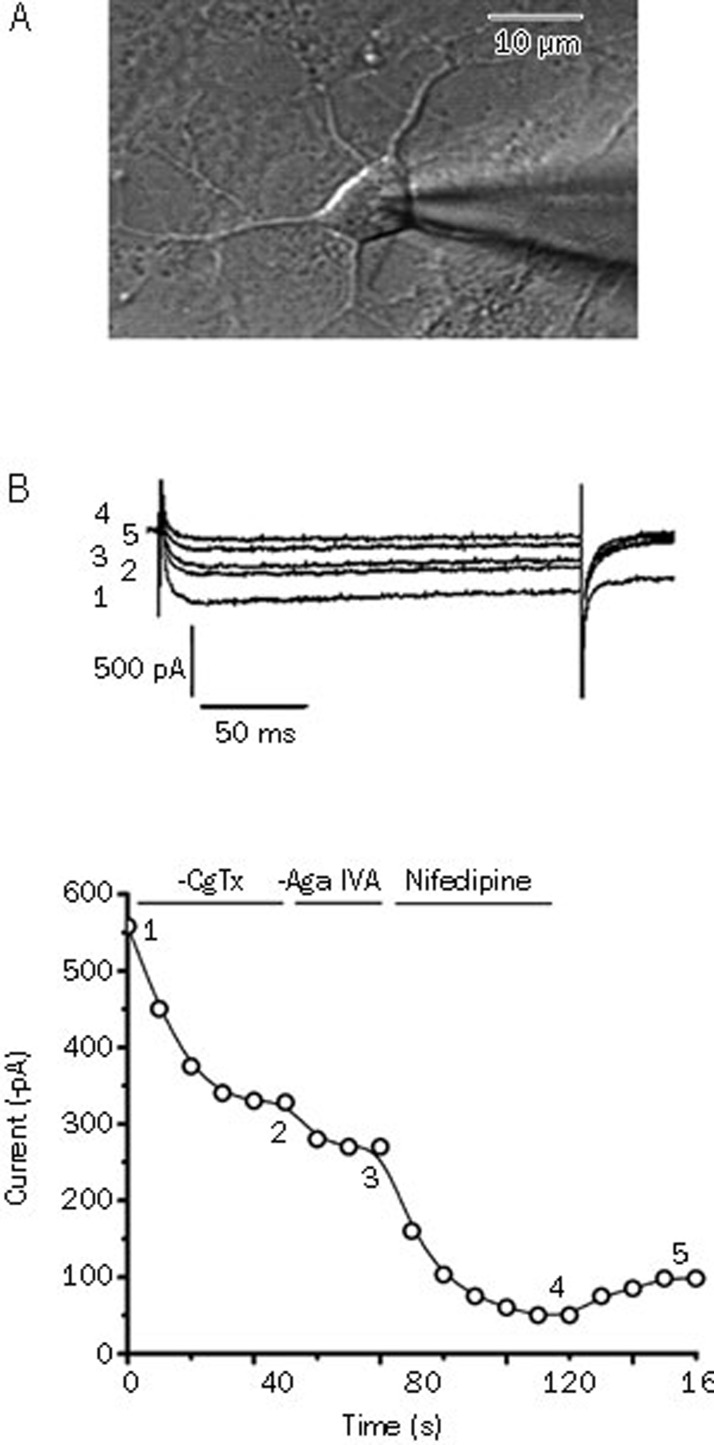
Figure 1.
(A) Phase-contrast image showing a single patch recording from 7-d cultured hippocampal neurons for the recording of the VGCCs. Scale bar, 10 μm. (B) Pharmacological separation of the VGCC subtypes in hippocampal neurons. Upper panel, inward Ca2+ channel Ba2+ currents evoked by pulses from −60 mV to 0 mV at the times indicated in the lower panel. Lower panel, time course of effects of ω-conotoxin GVIA (1 μmol/L), ω-agatoxin IVA (30 nmol/L) and nifedipine (10 μmol/L) on the Ba2+ current amplitude.

