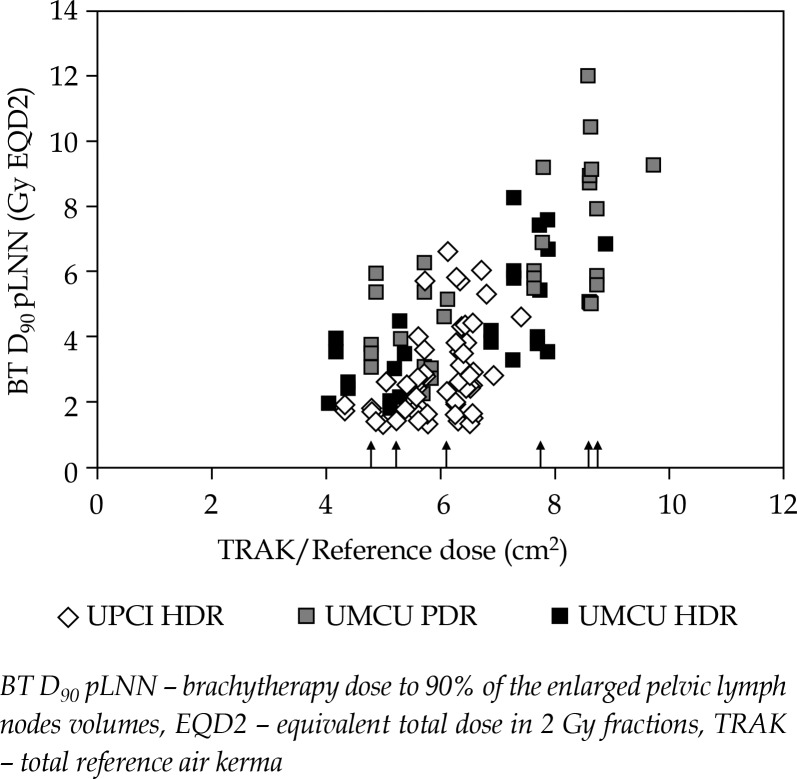
Fig. 3.
Dose contributions to individual lymph nodes as function of TRAK/Reference Dose; TRAK/Reference Dose is considered an indicator for the volume encompassed by the 100% isodose. Arrows indicate cases treated with a combined intracavitary/interstitial approach. Diamonds – UPCI (HDR). Grey squares – UMCU (PDR). Black squares – UMCU recalculated for HDR. The differences between black and grey squares show that the BT dose contribution (in EQD2) to pLNN is influenced by dose rate

