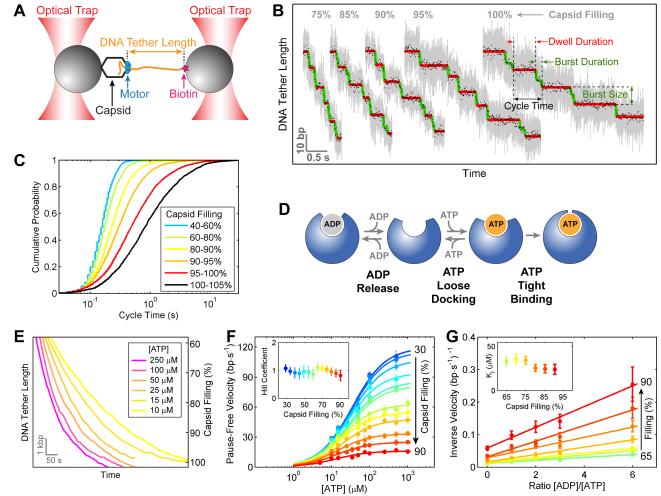
Figure 3. Motor Coordination Is Preserved at High Capsid Filling.
(A) Experimental geometry of the high-resolution packaging assay.
(B) Sample traces displaying individual packaging cycles at various levels of capsid filling. Raw 2500-Hz data are shown in gray and downsampled 100-Hz data in black. Stepwise fit to the data highlights dwells and bursts in red and green, respectively.
(C) Cumulative probability distribution of the packaging cycle times. Each color corresponds to a certain filling level.
(D) The nucleotide exchange scheme for each ATPase subunit.
(E) Sample packaging traces at low external loads (7–10 pN) and various ATP concentrations.
(F) Mean packaging velocity (pauses and slips removed) versus [ATP]. Each color represents a different filling level. The data are fit to the Hill equation, v = Vmax·[ATP]n/(KMn + [ATP]n). Inset: The Hill coefficient n from the fit.
(G) Inverse of the mean packaging velocity versus the ratio of [ADP] to [ATP] at different filling levels. [ATP] is fixed at 250 μM. The data are fit to a competitive-inhibition model, . Inset: The dissociation constant for ADP, KI, from the fit.
In panels F and G, error bars represent 95% confidence intervals (CI) estimated via bootstrapping.
See also Figure S2.

