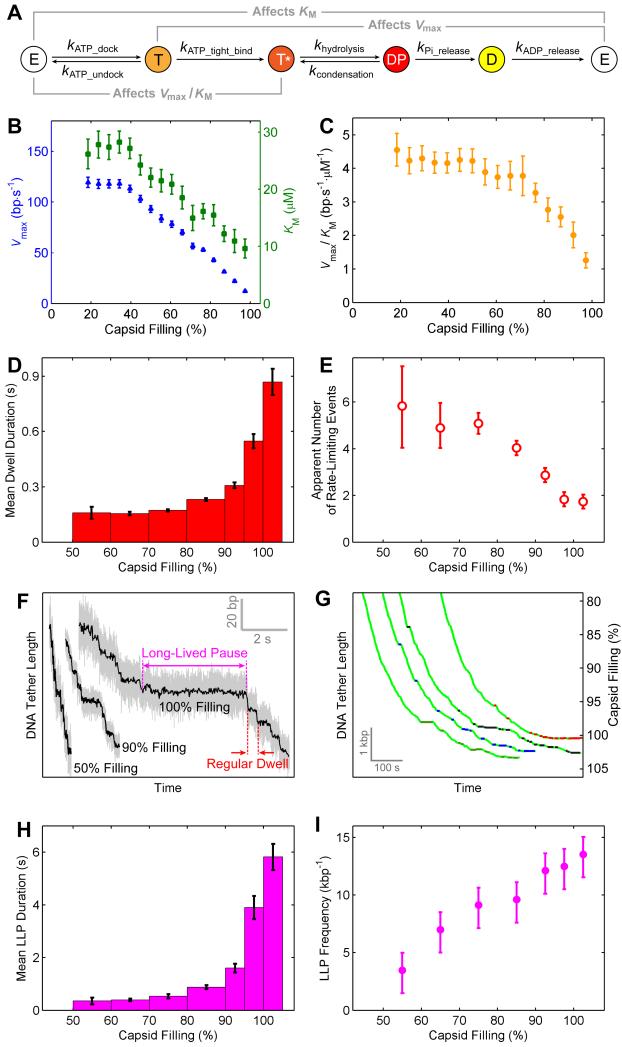
Figure 4. High Capsid Filling Slows ATP Tight Binding and Induces Long-Lived Pauses.
(A) The chemical cycle of each φ29 ATPase subunit.
(B) Vmax (blue) and KM (green) versus capsid filling.
(C) Vmax/KM versus capsid filling.
(D) Mean dwell duration versus capsid filling at saturating [ATP].
(E) Apparent number of rate-limiting kinetic events during the dwell versus capsid filling.
(F) Sample packaging traces at various filling levels highlighting regular dwells and long-lived pauses (LLPs).
(G) Sample traces highlighting the locations of LLPs. For clarity only LLPs longer than 5 s are shown. LLPs from different packaging complexes are colored green, blue, black, and red.
(H) Mean LLP duration versus capsid filling at saturating [ATP].
(I) Frequency of LLP occurrence versus capsid filling at saturating [ATP].
Error bars represent 95% CI.
See also Figures S3 and S4.

