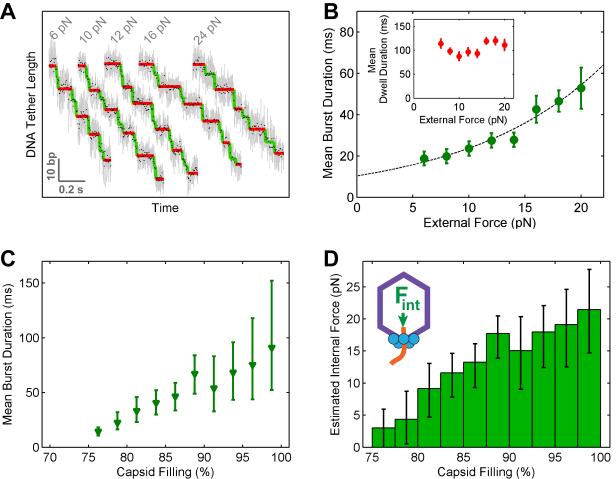
Figure 5. Capsid Filling Modulates the Burst Duration.
(A) Sample packaging traces collected at low capsid filling (15–30%) and various external loads. Raw 2500-Hz data are shown in gray and downsampled 100-Hz data in black. Stepwise fit to the data highlights dwells and bursts in red and green, respectively.
(B) Mean burst duration versus external force at low capsid filling (15–30%). The data are fit to an Arrhenius-type equation, τburst(F) = τburst (0)·eFΔx/kT (dashed curve, Δx = 0.33±0.08 nm from the fit). Inset: Mean dwell duration versus external force.
(C) Mean burst duration versus capsid filling.
(D) The magnitude of the internal force as a function of capsid filling, obtained by applying the τburst-F curve (panel B) to the τburst-filling dependence (panel C).
Error bars represent 95% CI.

