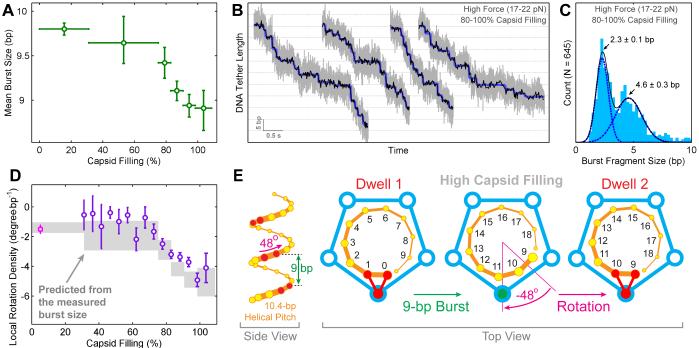
Figure 6. Capsid Filling Modulates the Step Size of the Motor without Affecting Subunit Coordination.
(A) Mean burst size versus capsid filling.
(B) Sample packaging traces at high capsid filling and high external loads revealing fragmented bursts. Raw 2500-Hz data are shown in gray, downsampled 150-Hz data in black, and stepwise fits in blue.
(C) Histogram of burst fragment sizes at high force and high filling. The distribution is well fit by two Gaussians that correspond to individual 2.3-bp steps and 4.6-bp burst fragments consisting of two consecutive 2.3-bp steps.
(D) DNA rotation densities inferred from the observed burst sizes (gray) and the measured rotation density values (purple and magenta) as a function of capsid filling.
(E) Illustration of how a smaller burst size results in a larger amount of DNA rotation (compare to Figure 2E).
Error bars represent 95% CI.
See also Figure S5.

