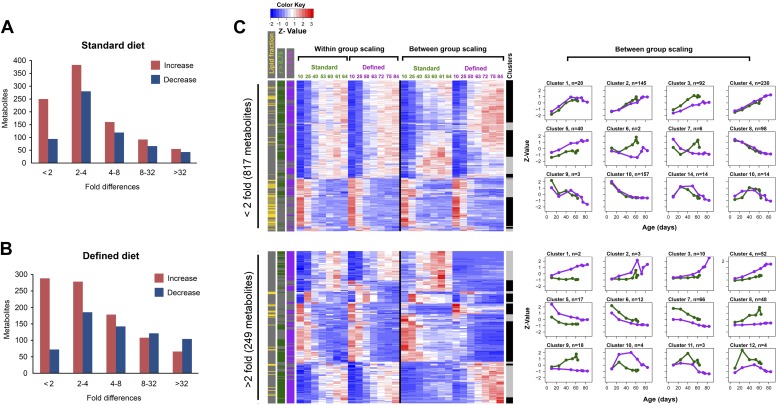
Figure 3. Distribution of fold-changes for age-related metabolites.
(A and B) Fold-change differences within standard (A) and defined (B) diets were calculated by comparing changes in intensity from the ratio of maximum to minimum lifespan-associated values. (C) Inter-dietary differences are shown in two heatmap panels after their separation into twofold thresholds, which also show metabolite remodeling during aging. Heatmaps were generated as follows. Replicate values were averaged and then scaled within individual and also across the diets. The resulting matrix was then subjected to age-guided complete hierarchical clustering using hclust algorithm in R where ages were assigned to columns and individual metabolites were assigned to rows. The resulting image allows convenient visualization of clusters containing metabolites with common trajectories (left side), which may also show inter-dietary differences in levels (right side). Side bars were added to highlight metabolites derived from the lipid fraction and also trajectories bearing strong correlation to lifespan curves (Pearson coefficient |r| >0.75, color coded for each diet). Age-related trajectories were derived from trimming the distance matrix into 12 k-means clusters using rect.hclust function in R. Plots in each box represent averages of the scaled values of contributing metabolites whose number is listed in at the top of each graph.

