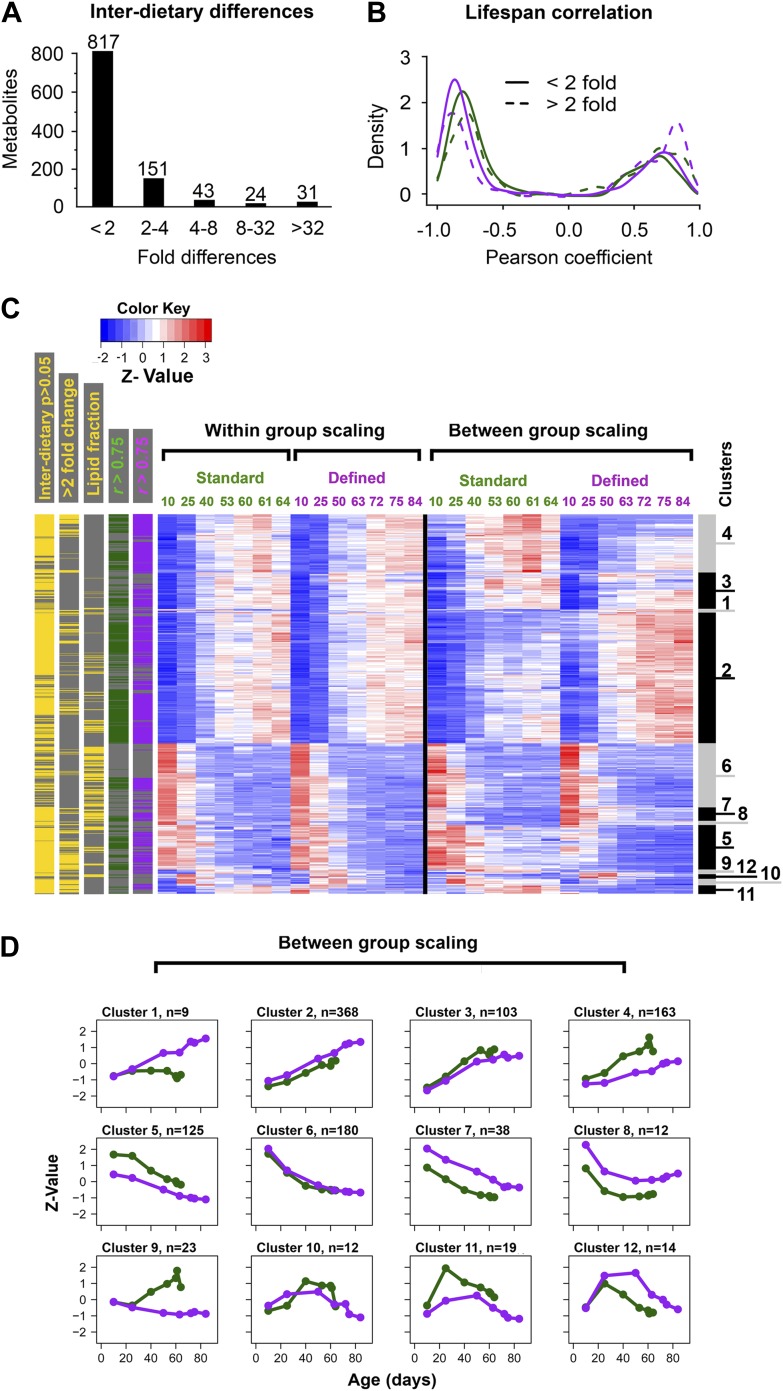
Figure 4. Common and distinct patterns of metabolite remodeling during the aging process.
(A) Fold-change differences between common age-related metabolites from two dietary conditions (inter-dietary differences). Fold change was calculated using averages of individual metabolite levels across each lifespan. (B) Distribution of Pearson coefficients. The Kernel-Density function in R was used to plot the distribution of all Pearson coefficients representing correlations between each of the age-related metabolites and lifespan curves for standard (green) and defined (purple) diets. Signals were split into groups that showed inter-dietary differences of under (solid lines) or above (dashed lines) twofold-change. (C) Signals were clustered using methods described in Figure 3C legend. Side bars were added to highlight positions of the metabolites bearing statistically significant inter-dietary differences (Student t test, p<0.05), metabolites meeting above twofold inter-dietary change, metabolites from the lipid fraction, and metabolites bearing strong correlation to lifespan (Pearson coefficient |r| >0.75, color coded for each diet). (D) Age-related trajectories were derived from the hierarchical tree as described in Figure 3C legend.

