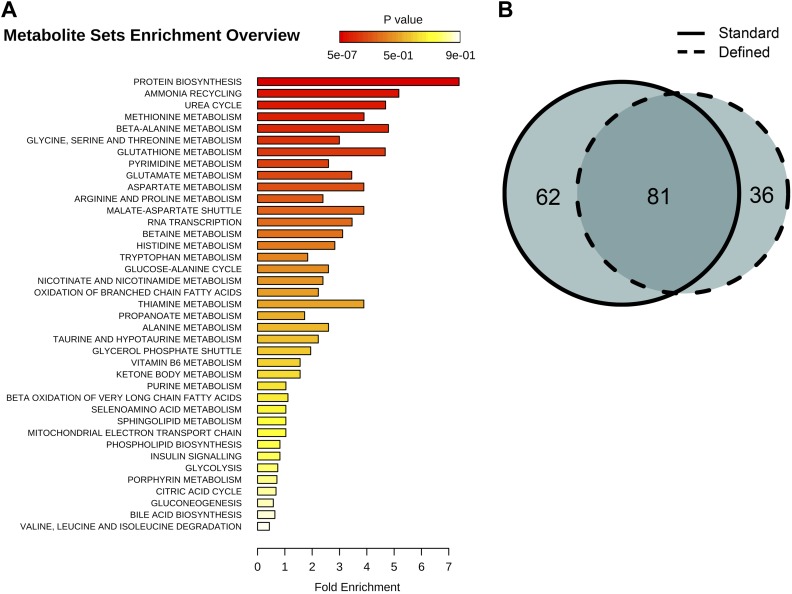
Figure 6. Identification and metabolic pathway representation of significant age-related targeted metabolites.
(A) Overview of molecules significantly associated with aging according to biological processes in both diets (repeated measures ANOVA, p<0.05). (B) Venn diagram showing the number of significantly changing metabolites with relation to the number of metabolites uniquely significant to standard (solid) or defined (dashed) diets.

