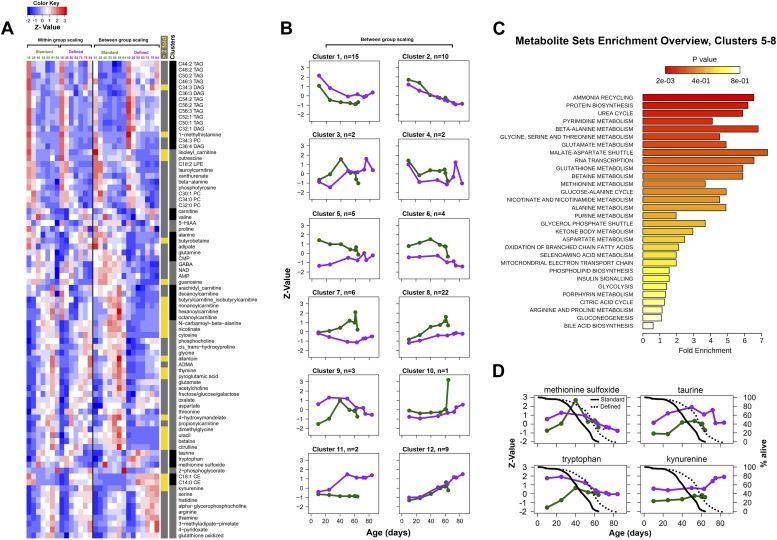
Figure 7. Metabolic signatures of aging in control and dietary restricted flies.
Annotated (targeted) metabolites were derived from raw nontargeted data and represent only signals of established chemical identities. (A and B) Patterns of targeted metabolites. Clustering and graphing were done identically to the procedures described for Figure 3C legends. Side bars highlight lipid species and cluster boundaries that correspond to consequently arranged plots in (B). (C) Metabolite set enrichment analysis was performed by MetaboAnalyst 2.0 (Xia and Wishart, 2011). The panel overviews low expressing signals in long-living flies (Clusters 5–8). (D) Metabolites representing known damage and lifespan limiting factors overlayed with lifespan curves for standard (solid) and defined (dotted) diets. Taurine and kynurenine showed statistically significant inter-dietary changes across lifespan. Methionine sulfoxide differed significantly between 10 and 25 day groups (Student t test p<0.50). Tryptophan showed no significant inter-dietary differences at 60–63 days. Circles correspond to sampled age groups, whereby z-scored expression values are generated from averages of randomly measured replicates representing separately sampled cohorts in standard (green) or defined (purple) diets.

