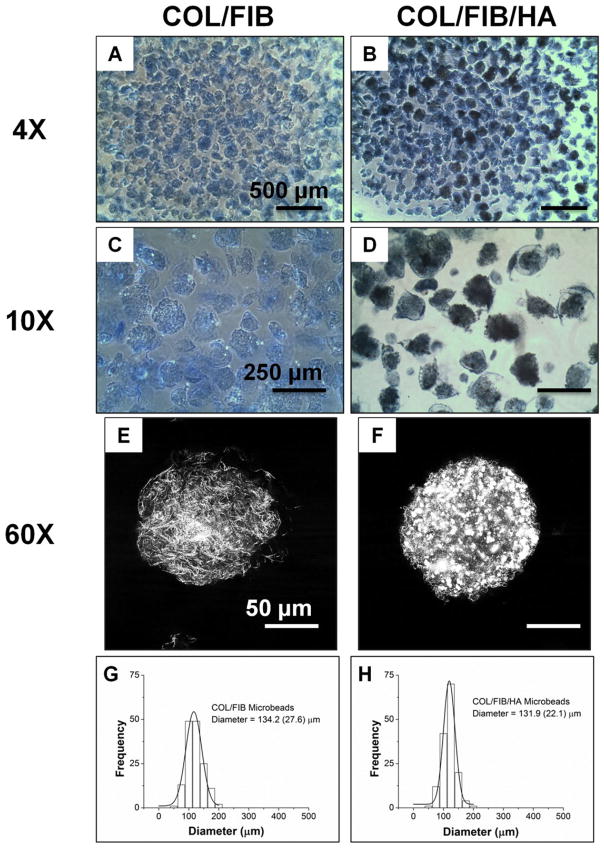
FIGURE 2.
Morphology and size distribution of acellular microbeads. Coomasie staining allowed for visualization of microbeads under light microscopy (4×, 10×). Images of the microarchitecture of microbeads obtained through confocal reflectance (60×). The addition of HA did not alter the size or the size distribution of microbeads. [Color figure can be viewed in the online issue, which is available at wileyonlinelibrary.com.]

