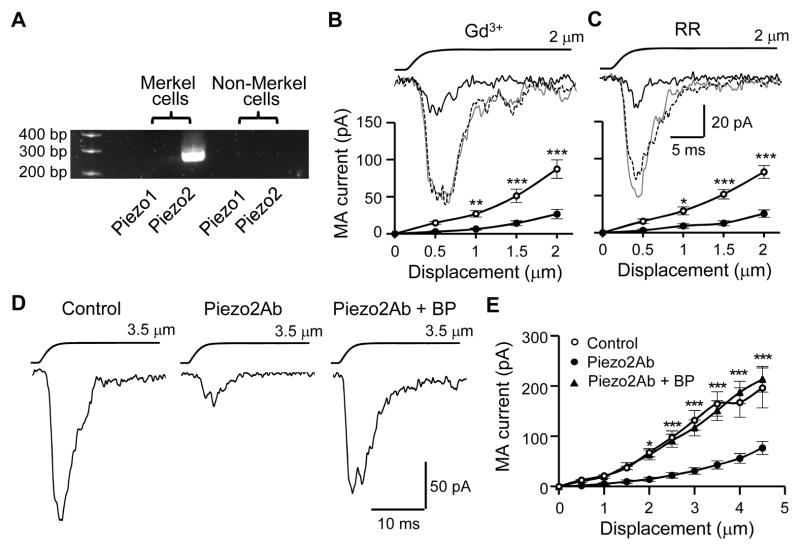
Figure 4. Expression of Piezo2 ion channels in Merkel cells and pharmacological properties of MA currents in Merkel cells.
(A) RT-PCR shows Piezo2 mRNA in Merkel cells. (B&C) Inhibition of MA currents in Merkel cells by 30 μM Gd3+ (B, n = 11) and 30 μM RR (C, n = 9). Sample traces (inset) represent MA currents before (gray line), 10 min following the bath application of Gd3+ or RR (black line), and after wash off (dashed line). The graphs are MA currents before (○) and following (●) the bath applications of the blockers. Indirect displacements were applied. (D) Sample traces of MA currents in the absence (control), presence of a Piezo2 antibody (Piezo2Ab), and the presence of the Piezo2Ab plus its blocking peptide (BP). MA currents were recorded 10 min after establishing the whole-cell mode and indirect displacement was applied at 3.5 μm. (E) Comparison of MA current amplitudes recorded 10 min after establishing the whole-cell mode. Control, n = 9; Piezo2Ab, n = 17; piezo2Ab+BP, n = 12. In D and E Piezo2Ab or Piezo2Ab+BP was applied through the patch-clamp internal recording solution. Data represent the mean ± SEM. * P < 0.05, **P < 0.01, ***P < 0.001, two-way ANOVA with Bonferroni post-hoc tests. See also Figure S3.

