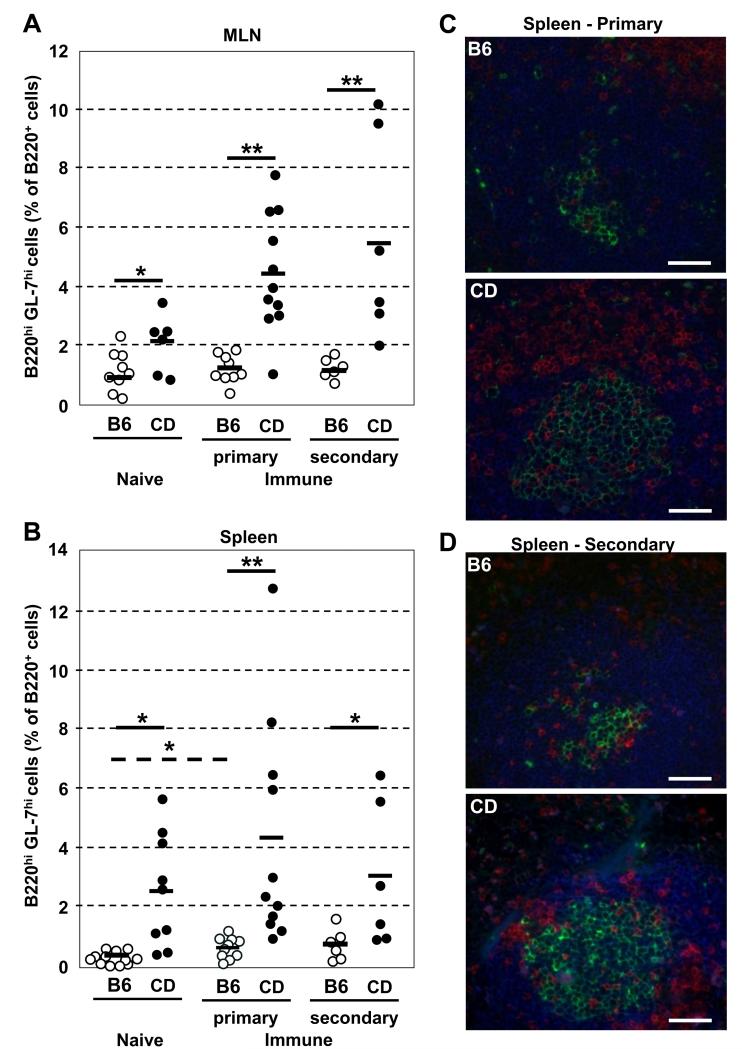
Figure 6. CD-RAG mice form robust GC responses after immunization with MPER peptide.
BL/6 (○) and CD-RAG (●) mice were immunized (i.p.) with 10 μg DP178-Q16L (MPER) peptide in alum. (A) MLN and (B) spleen cells were harvested at d16 after 1-2 immunizations. Cells were labeled with mAb to B220, IgM, IgD, TCRβ and GL-7. The percentage of B220hiGL-7hi B cells in B220hi cells was determined by flow cytometry. Each group contained multiple mice (n=6-12) compiled over multiple (n=2-4) independent experiments. Significant differences (*; p ≤ 0.05 and **; p ≤ 0.01) between groups were determined by (two-tailed) Student’s t-test. 5 μm sections of spleen from BL/6 and CD-RAG mice at d16 after (C) primary or (D) secondary immunizations were labeled with mAbs to B220-AF350 (blue), TCRβ-PE (red) and GL-7-FITC (green). FITC signal was amplified using anti-FITC-AF488 Ab. Scale bar equals 50μm for all images. Images were acquired using a Zeiss Axiovert 200M confocal immunofluorescent microscope at 200x magnification.

