
Fig. 1.
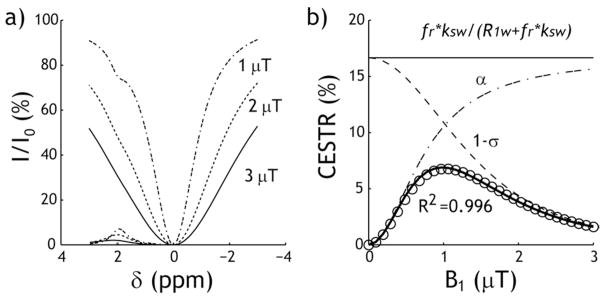
CEST MRI depends on the RF irradiation power level. a) Z-spectra and asymmetry curves simulated using Bloch-McConnell equations for three representative RF power levels of 1, 2 and 3 μT. b) The CEST ratio (CESTR) calculated with asymmetry analysis can be empirically described as a multiplication of the simplistic solution, the RF labeling coefficient, and the spillover factor.