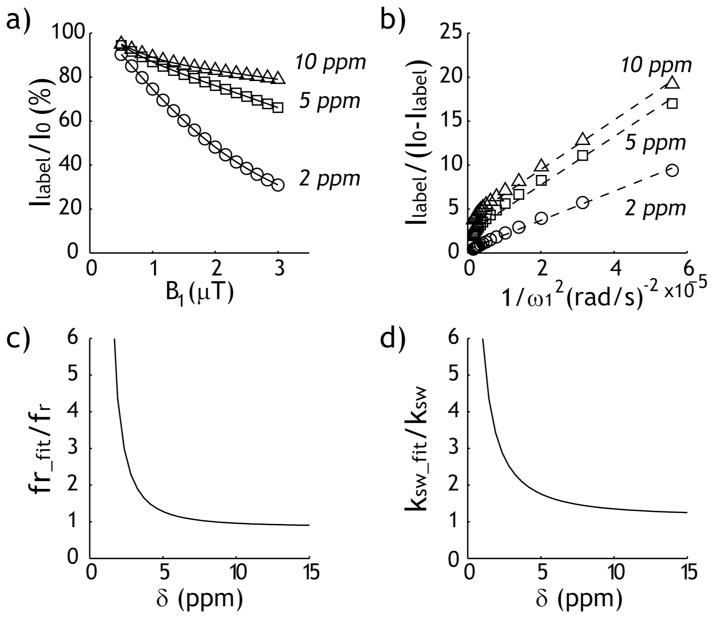
Fig. 3.
Conventional omega-plot analysis. a) Normalized label scan signal intensity as a function of B1 for three representative chemical shifts, 2, 5 and 10 ppm. b) Labile proton ratio and exchange rate can be obtained from omega plot. c) The ratio of derived labile proton with respect to simulated value shows as a function of chemical shift. d) The ratio of derived exchange rate with respect to simulated value shows as a function of chemical shift.

