
Fig. 7.
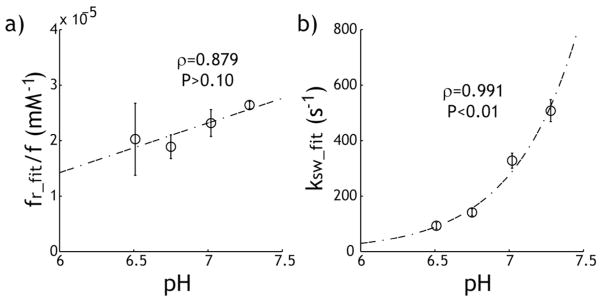
Evaluation of pH-dependent qCEST MRI analysis. a) The creatine concentration normalized labile proton fraction ratio shows little change with pH (P> 0.10). b) The labile proton exchange rate can be described using dominantly base-catalyzed chemical exchange relationship (P<0.01).