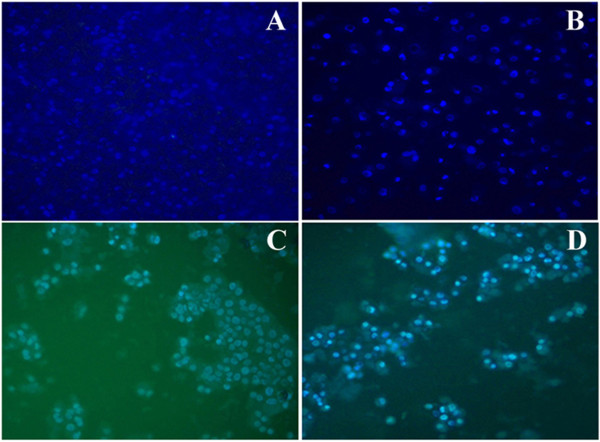
Figure 5.
IDOE-induced apoptosis in tumor cells. (A) Untreated A549 control cells, (B) A549 cells treated with 10.46 μg/mL IDOE, (C) Untreated T47D control cells, and (D) T47D cells treated with 1.3 μg/mL IDOE. The cells were treated with IDOE for 48 h, stained with Hoechst 33342 (10 μM) and examined by fluorescence microcopy at a magnification of × 20.

