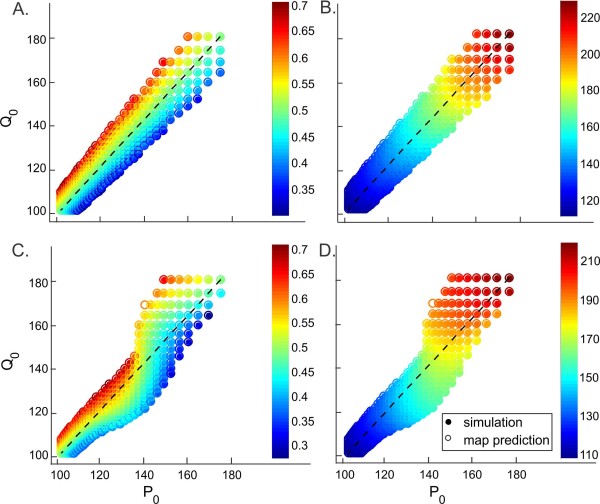
Fig. 11.
Coupling of non-identical M–L neurons. The phase of neuron A (a and c) and the period of the network (b and d) for coupled neurons with different intrinsic periods are shown for static synapses (a and b; ) and when the network follows the synaptic plasticity profile (c and d; , ). The axes are the intrinsic periods of the two neurons. Plasticity adds nonlinearity to the period and phase distribution. Filled circles denote simulation results whereas open circles denote the map predictions. The map yields predictions very close to the simulations in most cases

