Fig. 6.
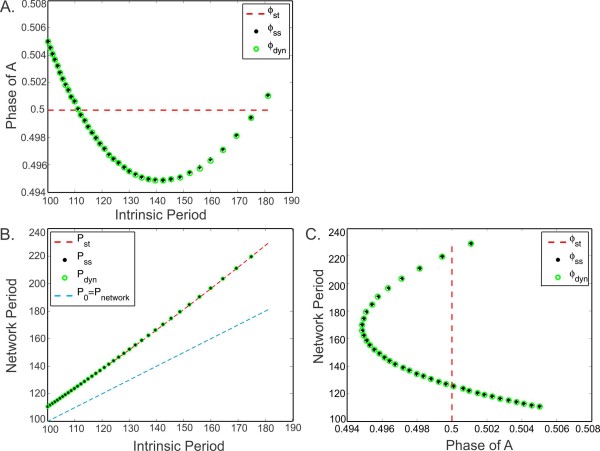
A comparison of the 1D (3.7), 2D (3.21) and 3D (3.16) maps. a The steady-state phase of the neuron A, from map (3.7), from map (3.16), from map (3.21), shown as a function of the intrinsic period of both neurons (changed simultaneously). b The network period as a function of intrinsic periods corresponding to the same maps. c The relation between the network period and the phase of A for the same maps. The phase of A reaches a minimum at the network period equal to the preferred period of neuron B. The results of the two maps with plasticity ((3.14) and (3.19)) overlap in all panels

