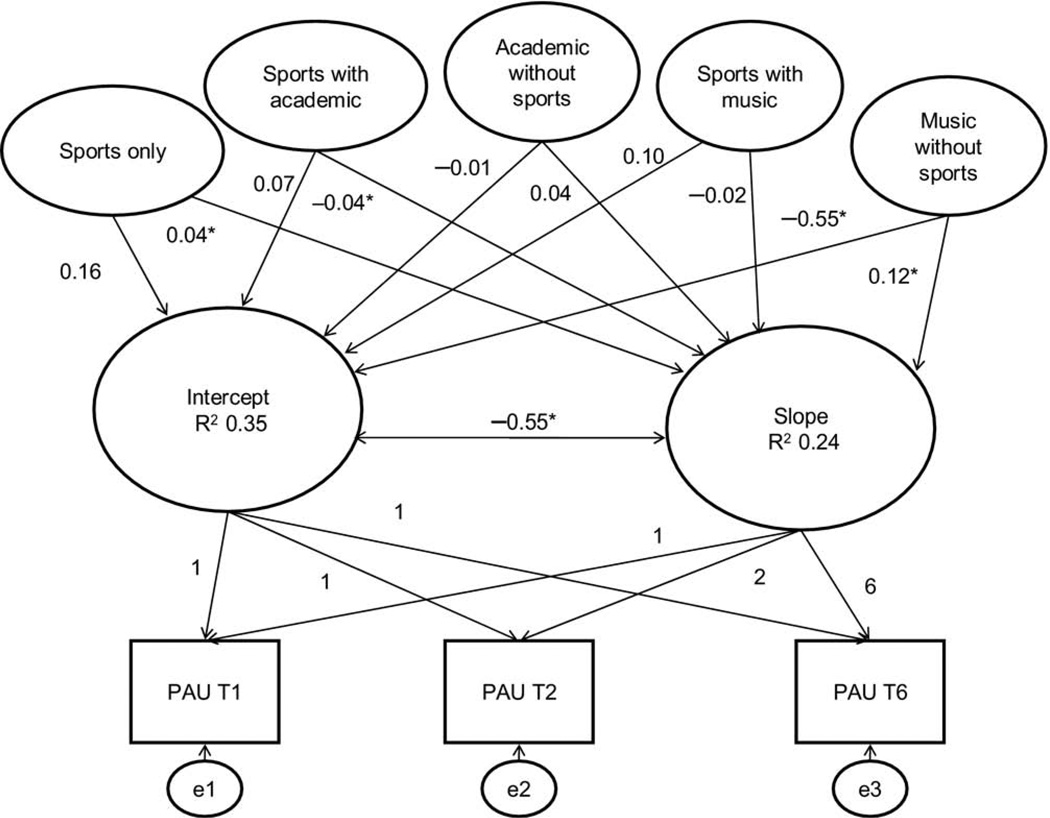
Figure 1.
Latent growth model for the sample
Note: Latent growth model among the entire sample (n = 8721). Model fit: χ2 (12) = 30.9, p = 0.002, CFI = 1.00, RMSEA = 0.01. Time-invariant (Wave-1) covariates not shown in the figure included gender, white race, age, parental alcoholism, friends’ drinking, and parental monitoring. Significant paths at p<0.05 are denoted by an asterisk. Error terms e1–e3 represent variability in measured problem alcohol use not explained by the model. Unstandardized coefficients are displayed.
CFI, comparative fit index; PAU, problem alcohol use; RMSEA, root mean square error of approximation

