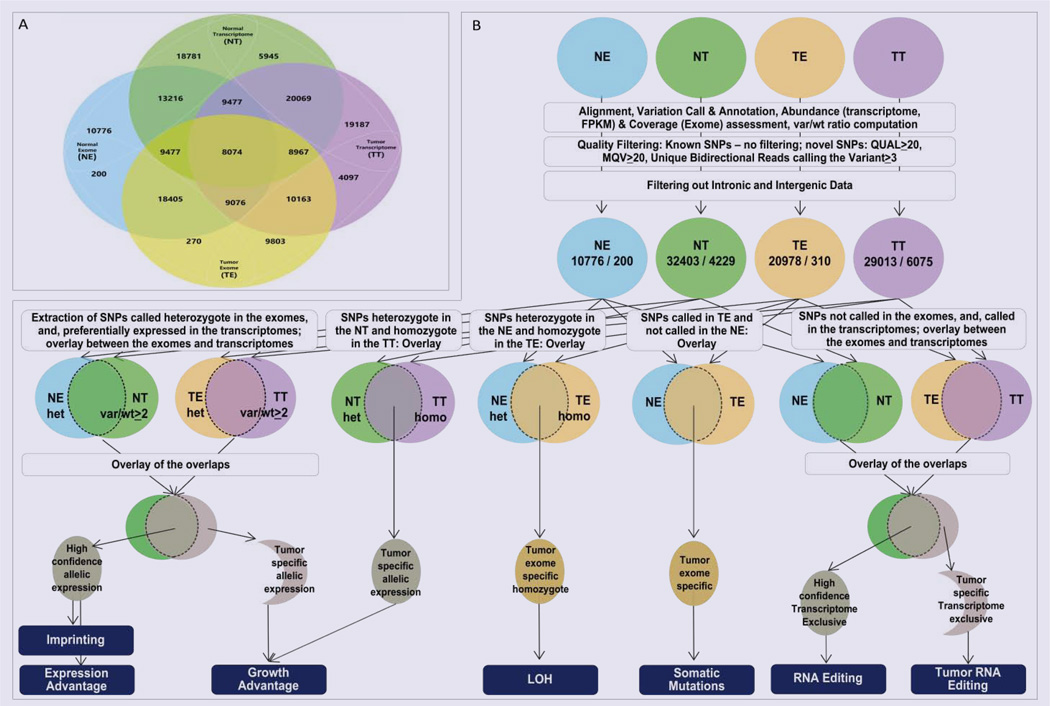
Figure 1.
Schematic representation of the overlay between four different NGS SNP datasets from the same individual: Normal Exome derived (NE), Normal Transcriptome (NT), Tumor Exome (TE) and Tumor Transcriptome (TT). (A) Number of SNPs exclusive and shared between the different datasets. (B) Analytical algorithms to extract regulatory features through comparison of the allelic representation of the variant and wild type read representation at the nucleotide position of the SNP.

