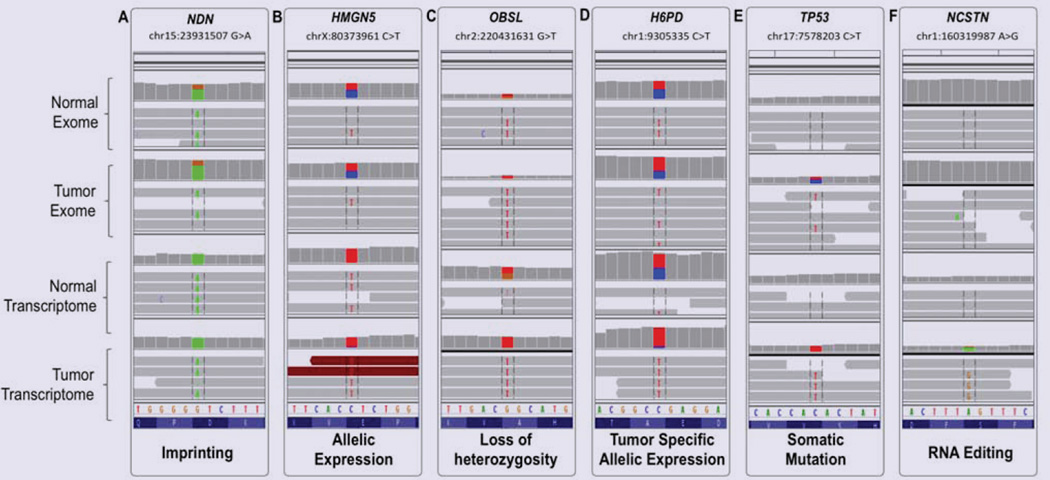
Figure 2.
Integrative Genomics Viewer (IGV) representation of examples of SNP calls aligned between the four analyzed datasets: Normal Exome, Tumor Exome, Normal Transcriptome, and Tumor Transcriptome. (A) G>A substitution on chr15:23931507 in NDN, representing imprinting: the variant nucleotide (A) is in heterozygote state in the exomes and in homozygote in the transcriptomes. (B) C>T substitution on chrX:80373961in HMGN5, representing strong allelic expression from the variant allele in both transcriptomes. (C) G>T onchr2:220431631 in OBSL1, representing LOH: the SNP is heterozygote in the normal exome and transcriptome, and homozygote in the tumor exome and transcriptome. (D) C>T onchr1:9305335 in H6PD, representing tumor specific allelic expression: the SNP is heterozygote in the exomes and normal transcriptome, and, homozygote in the tumor transcriptome. (E) C>T onchr17:7578203 in TP53 representing somatic mutation, likely driving: the variant is not present in the normal exome and transcriptome, and transitions from hetero- to homozygote from the tumor exome to tumor transcriptome. (F) A>G on chr1:160319987 in NCSTN representing RNA editing – the variant is not present in the exomes; it appears in the tumor transcriptome only, suggesting potential tumor specific editing mechanism.

