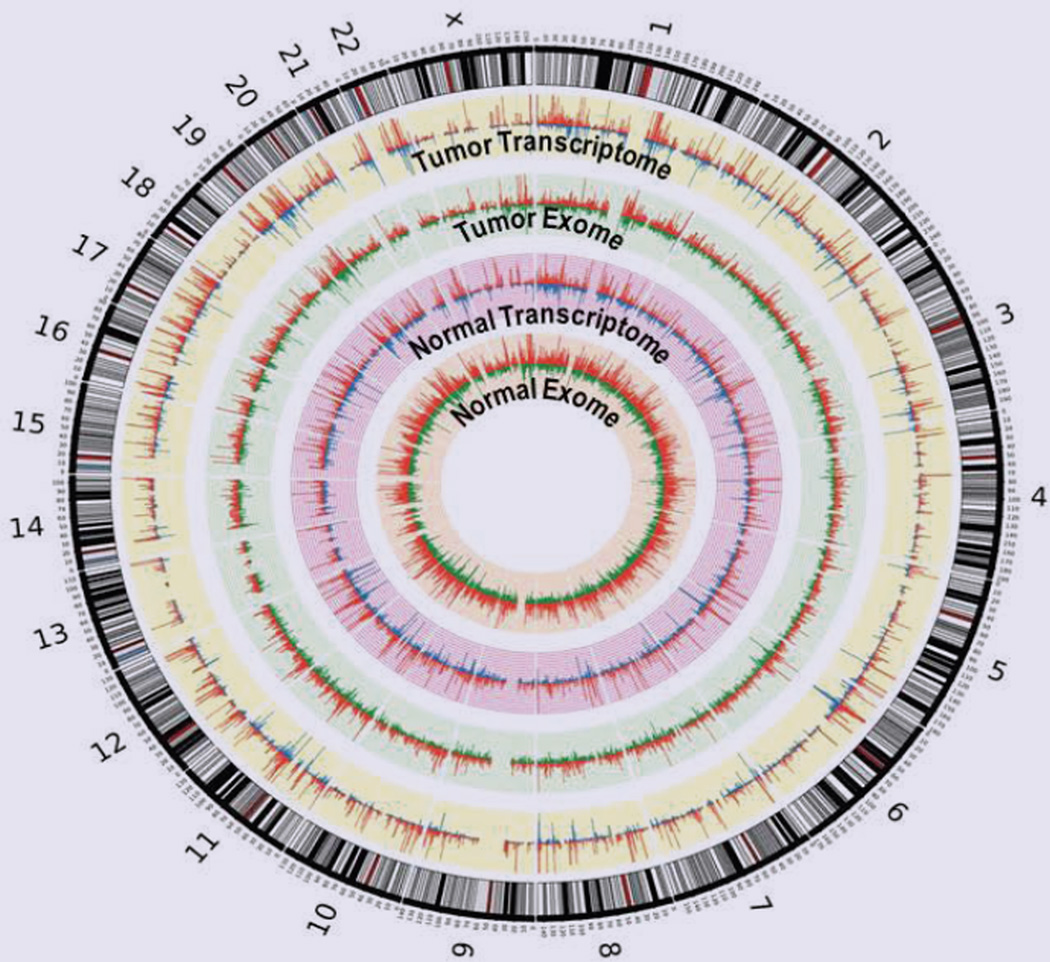
Figure 3.
Circos plots representing alignment of the number of variant and wild type reads at each genomic position at which SNP is called. Wild type read numbers are shown in blue for the exomes and in green for the transcriptomes, and the variant reads are orange in the exomes and red in the transcriptomes.

