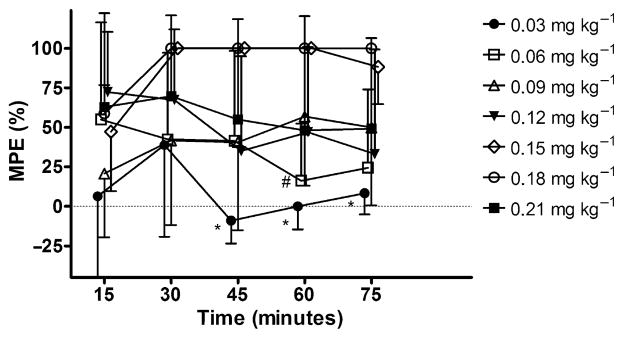
Figure 2.

Effects of IP administration of D (mg kg−1) on tail-flick latency in rats. Each bar represents the mean ± SD of group (n = 5) tail-flick latency expressed as percent maximum possible effect (MPE%). * and #, significantly different (p < 0.05) from corresponding higher doses of drug at specified time points.
