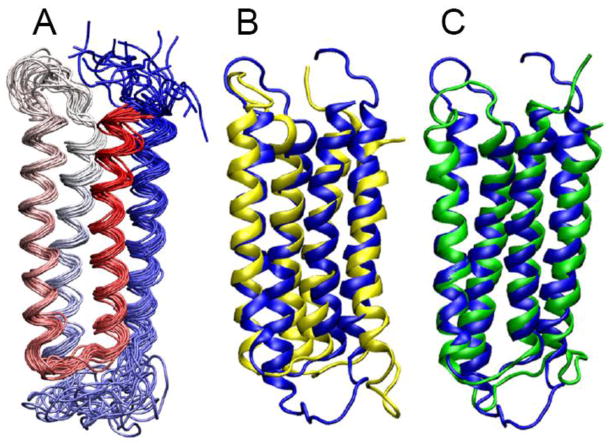
Fig. 2. NMR structures of the α7 TM domain.
(A) A bundle of the 20 lowest-energy structures of the α7 TM domain (PDB ID: 2MAW). The structures are color-scaled from red for TM1 to blue for TM4. The backbone atom RMSD for the helical regions is 1.24 ± 0.32 Å. Full statistics for the α7 structure calculations are summarized in Table S1. (B) Overlay of representative structures of α7 (blue) and α4 (yellow; PDB ID: 2LLY). The backbone atom RMSD for the helical regions of α7 and α4 is 2.9 A. (C) Overlay of representative structures of α7 (blue) and β2 (green; PDB ID: 2LM2). The backbone atom RMSD for the helical regions of α7 and β2 is 2.1 Å.

