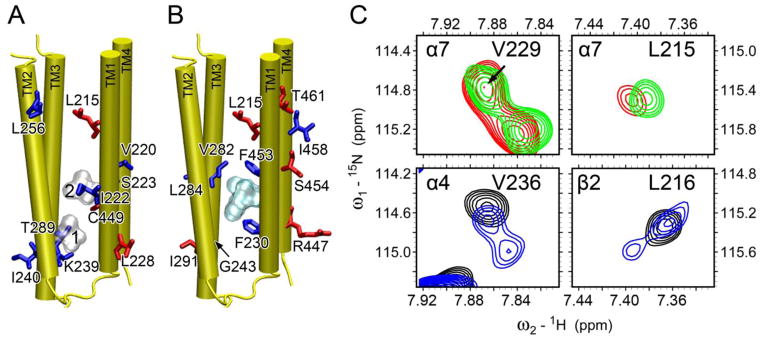
Fig. 6. Anesthetic effects on backbone dynamics of the TM domain of the human α7 nAChR.

br>Residues, whose relative peak intensity increased (red) or decreased (blue) upon the addition of (A) halothane (silver surface) and (B) ketamine (cyan surface) binding, are highlighted in the α7 structure. (C) Representative regions of 1H-15N TROSY-HSQC spectra in the absence (red or black) and presence (green or blue) of halothane. α7-V229 (top, left) is equivalent to α4-V236 (bottom, left); α7-L215 (top, right) is equivalent to β2-L216 (bottom, right). Note the halothane-induced peak splitting in α4-V236 and β2-L216, a sign of decrease of conformational exchange rates by halothane. Such changes were not observed in α7.
