
Figure 5. Loss of Nos function leads to over-active flies.
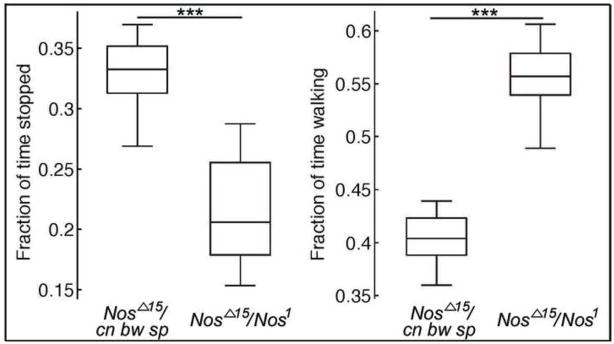
Schematic showing fraction of time spent stopped or walking for flies of the indicated genotype. The center line denotes the median, the rectangle marks the 25th and 75th quartile of the data, and the whiskers show the range of the data. For flies of the NosΔ15/cn bw sp genotype, data are shown for 12 cohorts of 20 flies (10 males and 10 females). For flies of the NosΔ15/Nos1, data are shown for 10 cohorts of flies (10 males and 10 females). Each n is the data forall 20 flies during the entire video). The difference in the fraction of time spent stopped or walking is significant between the two genotyps: p = 1.9 × 10⁻⁴ (stopped); p = 8.7 × 10⁻⁵ (walking). The collected data did not pass normality tests; thus, the Mann-Whitney U test was used to test for significance.