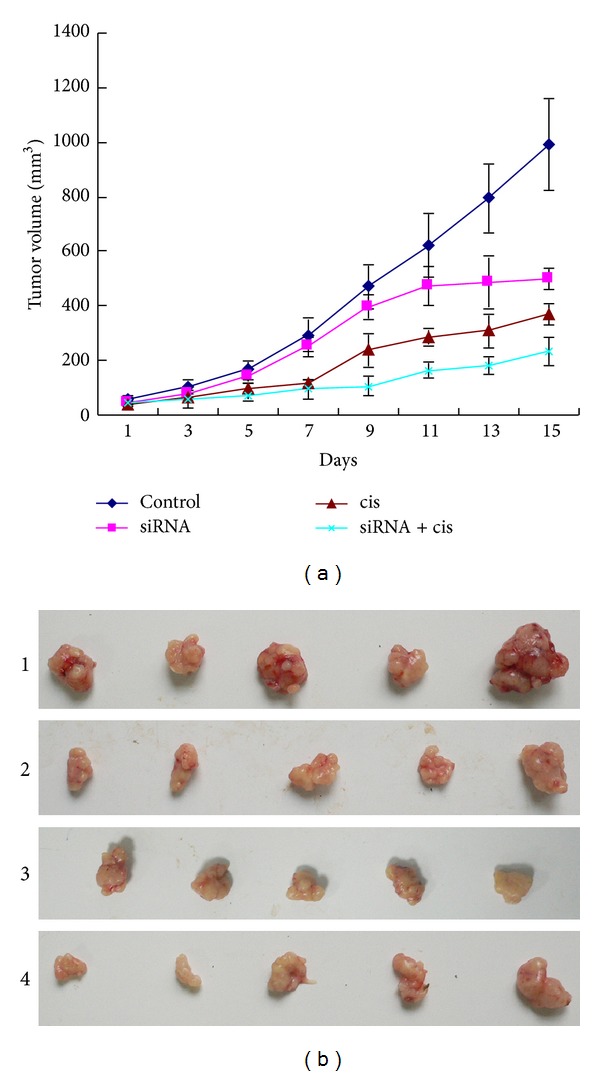
Figure 3.

Tumor regression observed in EC9706 xenografts treated with different ways. (a) Tumor volumes from the xenografts of groups each were assessed every day, as described in Materials and Methods, and the results were expressed as means ± SE (mm3). The tumor growth of treated groups each became slow, in which group treated with mTOR siRNA combined with cisplatin was the slowest. (b) Tumors from the xenograft treated with different ways for two weeks. 1, 2, 3, and 4 represent control, mTOR siRNA, cisplatin, and mTOR siRNA + cisplatin groups, respectively.
