. 2014 Apr 24;3:e02008. doi: 10.7554/eLife.02008

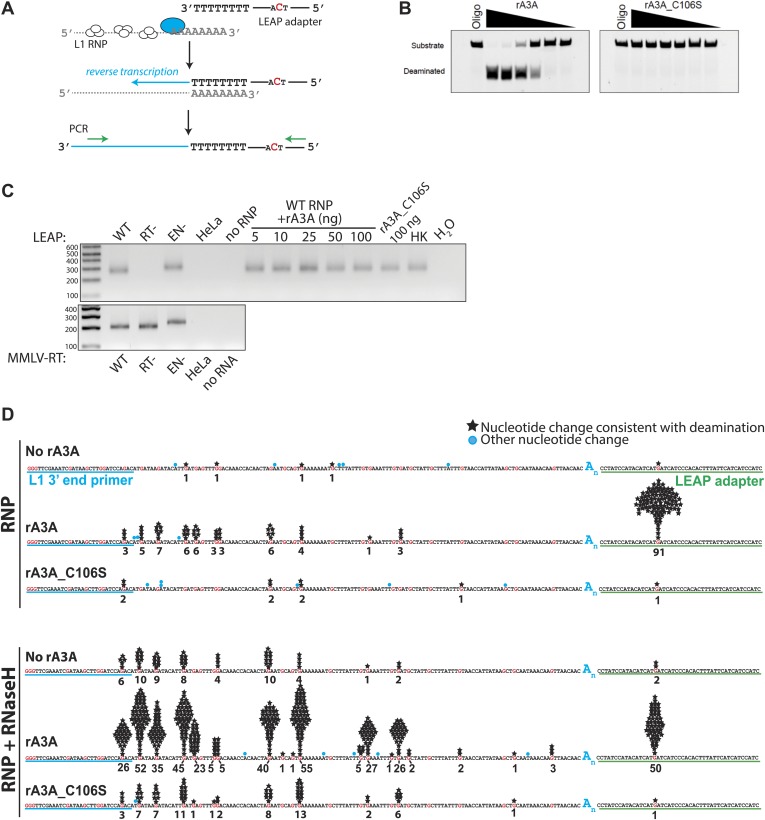
Figure 2. Recombinant A3A (rA3A) deaminates L1 cDNAs in vitro.

(A) LEAP assay rationale: L1 RNP preparations consisting of the L1 RNA (gray), L1 ORF1p (white ovals), and L1 ORF2p (blue oval) are incubated with a 3′ RACE primer consisting of a unique adapter sequence that contains a single cytidine (red) followed by an oligo dT sequence (black lettering). After reverse transcription (blue arrow), the resultant L1 cDNAs (blue line) are PCR amplified using primers specific to the engineered L1 and the unique adapter sequence (green arrows). (B) Recombinant A3A has deaminase activity in vitro: twofold serial dilutions (500 ng–15.62 ng) of WT rA3A (left panel) or deaminase-deficient rA3A_C106S (right panel) were incubated with a fluorescein isothiocyanate (FITC) labeled single-strand DNA oligonucleotide containing a single cytidine residue. The products were treated with recombinant uracil DNA glycosylase (UDG) and NaOH and then were resolved by gel electrophoresis. A control reaction was included without recombinant protein (marked Oligo). (C) Recombinant A3A does not inhibit L1 RT activity: control LEAP reactions with RNP preparations from HeLa cells transfected with WT (pDK101), RT- (pDK135), or EN- (pJJH230A/L1.3) human L1s (upper gel). HeLa indicates untransfected HeLa cells; no RNP indicates control reactions lacking RNPs. Increasing amounts of rA3A (ng) did not significantly affect LEAP activity. Samples containing a deaminase-deficient rA3A_C106S, a heat killed rA3A (HK), or without LEAP products (H2O) served as controls. MMLV RT reactions (lower gel) confirm the integrity of purified RNA isolated from RNP preps used in the LEAP assay. Notably, the increased size of the EN- RNP RT products is due to a higher molecular weight product generated from pJJH230A/L1.3, which contains an mblastI indicator cassette instead of an mneoI indicator cassette. Size standards (bp) are indicated at the left of the gel. (D) Sequence characterization of LEAP Products: shown is the (+) strand sequence of the LEAP product. Guanosine nucleotides are indicated in red. Black stars and numbers indicate the frequency of G-to-A mutations (corresponding to C-to-U mutations in the minus (−) strand L1 cDNA) that occurred on (+) strand L1 cDNA. Blue circles indicate other nucleotide changes. The blue An indicates the LEAP product poly (A) tail. Blue underlining indicates the L1 3′ end PCR primer. Green underlining indicates the LEAP adapter (5np1) sequence. Top panel: LEAP products generated under the following conditions: no rA3A protein, 100 ng of wild-type rA3A, 100 ng of deaminase-deficient rA3A_C106S. Bottom panel: LEAP products generated under the following conditions in the presence of RNase H: no rA3A protein, 100 ng of wild-type rA3A, 100 ng of deaminase-deficient rA3A_C106S. One hundred products were characterized for each condition.

DOI: http://dx.doi.org/10.7554/eLife.02008.005

Figure 2.

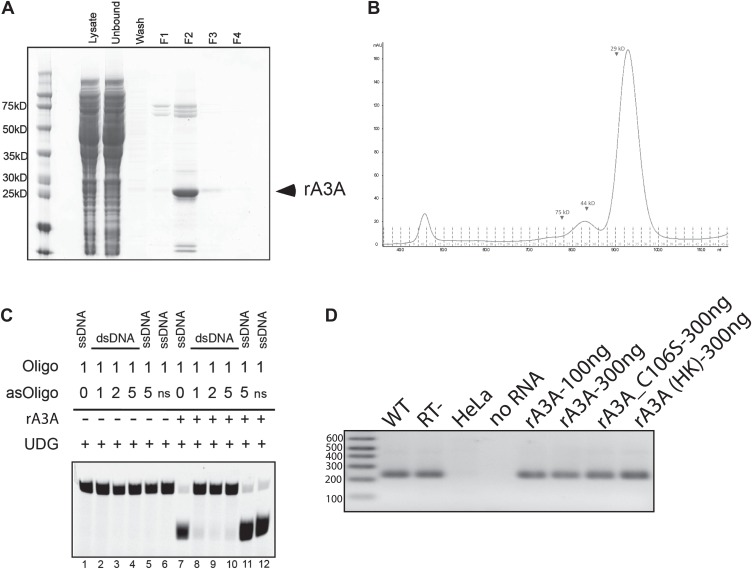
Figure 2—figure supplement 1. Control Experiments with Recombinant A3A.

Figure 2—figure supplement 1.

(A) Purification of rA3A from E. coli by Ni affinity: SDS 4–12% polyacrylamide gel electrophoresis and Coomassie blue staining were used to monitor purification of the His-tagged recombinant A3A (rA3A) protein. Input bacterial lysate was loaded onto the Ni-Sepharose column (Lysate). Flow through lysate and wash fractions were collected (Unbound and Wash, respectively). Recombinant A3A was eluted from the column with lysis buffer containing 0.5M imidazole and consecutive elution fractions were collected (F1-4). Most of the His-tagged rA3A was eluted in F2 (arrow). Approximate molecular sizes (kD) are indicated at the left of the gel. (B) Purification of rA3A by gel filtration: recombinant A3A purified by Ni-Affinity was further purified by gel filtration by fast protein liquid chromatography (FPLC) on a Superdex 200 column. Arrows indicate the approximate molecular weights (kD) of the proteins. The x-axis indicates the elution volumes and fraction numbers. The y-axis indicates the UV absorbance at 280 nm. (C) Recombinant A3A does not deaminate double-stranded DNA: single-strand (lanes 1 and 7) or double-stranded DNA (lanes 2–4 and 8–10) substrates were incubated without (−) or with (+) rA3A (250 ng), were treated with UDG, and the products were resolved by gel electrophoresis on 15% polyacrylamide TBE-Urea Novex gels (Invitrogen). The relative ratios of the target (Oligo) and complementary (asOligo) oligonucleotides are indicated at the top of the figure. A non-specific oligonucleotide (ns) was also included as a control (lanes 6 and 12). As an additional control to rule out potential competition of free asOligo for UDG activity, asOligo was added after rA3A incubation with ssDNA Oligo (lanes 5 and 11). (D) Recombinant A3A does not inhibit MMLV-RT activity: from left to right: MMLV RT reactions using purified RNA isolated from pDK101 (WT) or pDK135 (RT-) RNPs, untransfected HeLa cell RNPs (HeLa), and a no RNA sample. Recombinant WT rA3A (100 ng and 300 ng), deaminase-deficient rA3A_C106S (300 ng), and ‘heat-killed’ rA3A (300 ng) were included in MMLV RT reactions. Size standards (bp) are indicated at the left of the gel image.

Figure 2—figure supplement 2. A3A Deamination Events in LEAP products.

Figure 2—figure supplement 2.

Each chart lists all possible trinucleotide contexts with a ‘G’ as the middle nucleotide (corresponding to a ‘C’ on the first-strand LEAP cDNA). The first column shows the number of times each trinucleotide appears in the LEAP product sequence. Grayed-out rows indicate that the trinucleotide is not present in the LEAP product sequence. The second column lists how many times each trinucleotide is available in 100 LEAP products. The third column quantifies how many times a deamination event was observed within each trinucleotide. The fourth column quantifies the percent of available sites deaminated in 100 LEAP products. Colored rows below each chart indicate the overall frequency of deamination events of all ‘G’ nucleotides. An additional colored cell, below and to the right of each chart, lists the percent of sequences deaminated at the sole ‘C’ nucleotide in the single-strand oligonucleotide adapter sequence. Specific data points mentioned in the text are highlighted in red on each chart.

Figure 2—figure supplement 3. Distribution of deamination events per LEAP product.

Figure 2—figure supplement 3.

The x-axis indicates the number of G-to-A changes; the y-axis indicates the number of LEAP products.

Figure 2—figure supplement 4. Summary of LEAP products generated in the presence of rA3A and RNase H.

Figure 2—figure supplement 4.

Individual LEAP products (first column) were generated from four independent LEAP reactions, indicated by colored shading. For each product, poly-A tail length (second column), the total number of G-to-A changes (third column), and the total number of other nucleotide changes (fourth column) are indicated. Columns G29 through G155 represent the 19 nucleotide positions that were deaminated in WT rA3A-containing LEAP reactions. For each product, an ‘X’ indicates the specific location of a deamination event. The Adapter column indicates deamination events within the single-strand LEAP adapter.