. 2014 Apr 24;3:e02008. doi: 10.7554/eLife.02008

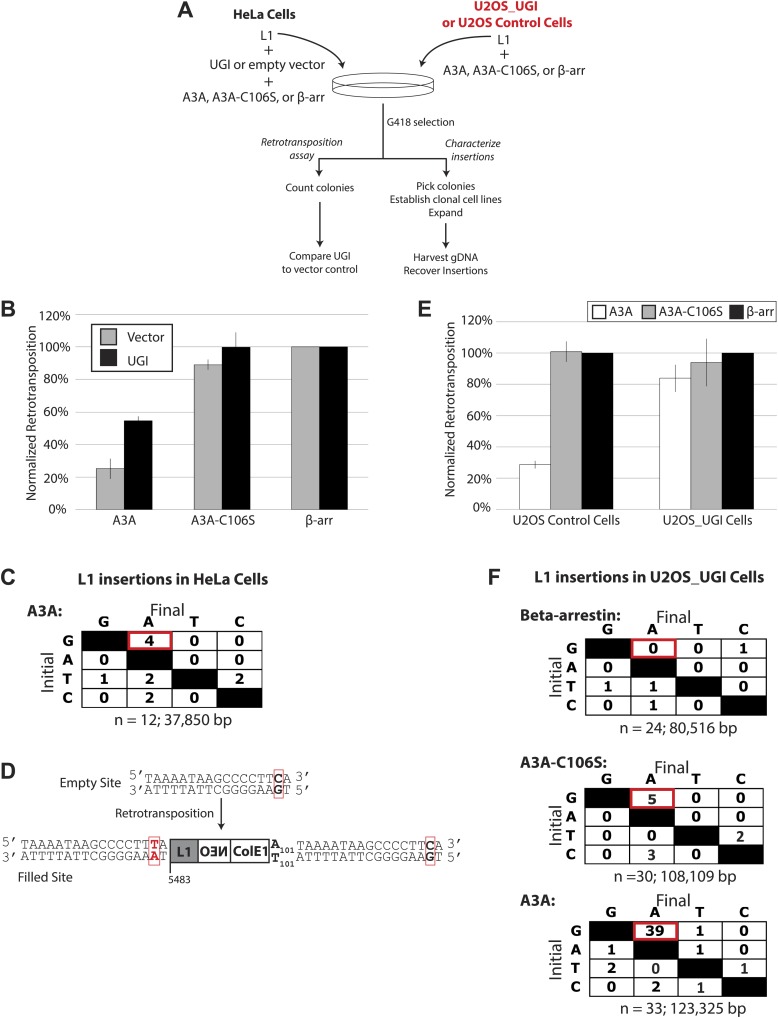
Figure 3. UGI expression alleviates A3A-mediated inhibition of L1 retrotransposition and allows detection of deaminated L1 retrotransposition events.

(A) Experimental strategy: cells (HeLa, upper left, or U2OS, upper right) were co-transfected with the indicated expression plasmids and assayed for L1 retrotransposition (bottom left branch) or insertion analysis (bottom right branch). (B) UGI expression alleviates A3A-mediated retrotransposition inhibition: the x-axis indicates the co-expression vector. The y-axis depicts the efficiency of L1 retrotransposition. Shown are results of experiments in the presence (black bars) or absence (gray bars) of UGI. The results were normalized as in Figure 1—figure supplement 1A. Data are expressed as the mean percent retrotransposition derived from three independent experiments consisting of two technical replicates each, with error bars representing the standard deviation among all six technical replicates. (C) DNA sequencing results: the left column indicates the engineered L1 sequence. The top row indicates sequence changes observed in recovered L1 insertions; n indicates the number of characterized retrotransposition events. The total retrotransposed sequence observed (in bp) includes the L1 sequence and the mneoI/ColE1 cassette. (D) An L1 insertion harboring mismatched TSDs: The pre- (empty) and post- (filled) L1 integration sites are shown. The truncation point (bp 5483) and structure of the engineered retrotransposed L1 are indicated. Deamination of single-strand genomic DNA in the pre-integration site (red rectangle) leads to inexact TSDs in the post-integration site (red lettering/rectangles). (E) Stable UGI expression alleviates A3A-mediated L1 inhibition: The x-axis indicates the U2OS cell line. The y-axis depicts the efficiency of L1 retrotransposition. Shown are the effects of wild-type A3A (white bars), A3A-C106S (gray bars), and β-arrestin (β-arr, black bars) control on L1 retrotransposition. Data were normalized to controls conducted with a circular NEO expression vector (Figure 3—figure supplement 1 B–C). Data are expressed as the mean percent retrotransposition derived from three independent experiments consisting of two technical replicates each, with error bars representing the standard deviation among all six technical replicates. (F) DNA sequencing results: The left column indicates the engineered L1 sequence. The top row indicates sequence changes observed in recovered L1 insertions; n indicates the numbers of characterized retrotransposition events. The total retrotransposed sequence observed (in bp) includes the L1 sequence and the mneoI/ColE1 cassette.

DOI: http://dx.doi.org/10.7554/eLife.02008.010

Figure 3.

Figure 3—figure supplement 1. Additional Control Experiments.

Figure 3—figure supplement 1.

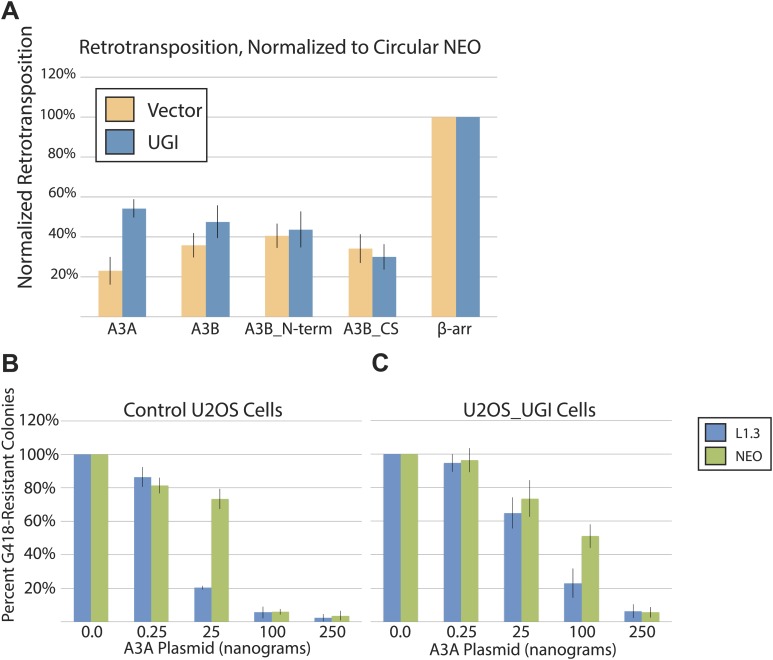
(A) UGI does not alleviate L1 retrotransposition inhibition by APOBEC3B cytidine deaminase mutants (pK_A3B_Nterm and pK_A3B_CS): HeLa cells were transfected with 1 μg each of an APOBEC3 expression vector (WT pK_A3A, WT pK_A3B, deaminase-deficient pK_A3B_Nterm, deaminase-deficient pK_A3B_CS, or pK_ β-arrestin), an L1 vector (pJM101/L1.3), and pLGCX/UGI or pLGCX empty vector. The x-axis indicates the APOBEC3 expression construct. Orange bars: vector only control. The y-axis indicates percent retrotransposition, with the β-arrestin control for each reaction set to 100%. Blue bars: UGI expression. Data were normalized to circular NEO control co-transfections. Data are expressed as the mean percent retrotransposition derived from three independent experiments consisting of two technical replicates each, with error bars representing the standard deviation among all six technical replicates. Notably, UGI expression does not affect the ability of the deaminase-deficient A3B mutants (pK_A3B_Nterm and pK_A3B_CS) to inhibit L1 retrotransposition. (B) Effect of A3A expression on L1 retrotransposition and circular NEO controls in control U2OS cells: control U2OS cells were transfected with a total of 1.25 μg of DNA, including 1.0 μg of pJM101/L1.3 plasmid. For the β-arrestin control transfections, 250 ng of β-arrestin plasmid were used in the experiments. A3A transfections consisted of 0.0 ng, 0.25 ng, 25 ng, 100 ng, or 250 ng of A3A expression vector and the appropriate amount of β-arrestin plasmid to bring total plasmid mass to 1.25 μg. Blue bars indicate pJM101/L1.3; green bars indicate the pU6i NEO control. The x-axis shows the amount of A3A plasmid used in the experiment. The y-axis shows percent of G418-resistant colonies, with β-arrestin control co-transfection (0 ng A3A) set to 100%. Data are expressed as the mean percent G418-resistant colonies derived from two independent experiments consisting of two technical replicates each, with error bars representing the standard deviation among all four technical replicates. (C) Effect of A3A expression on L1 retrotransposition and circular NEO controls in U2OS_UGI cells: co-transfection experiments were carried out as described in Extended Data Figure 3B. Blue bars indicate pJM101/L1.3; green bars indicate pU6i NEO control. The x-axis shows the amount of A3A plasmid used in the experiment. The y-axis shows percent of G418-resistant colonies, with β-arrestin control co-transfection (0 ng A3A) set to 100%. Data are expressed as the mean percent G418-resistant colonies derived from two independent experiments consisting of two technical replicates each, with error bars representing the standard deviation among all four technical replicates.

Figure 3—figure supplement 2. Summary of L1 retrotransposition events generated in U2OS_UGI cells in the presence of β-arrestin.

Figure 3—figure supplement 2.

The pJM140/L1.3/Δ2/k7 retrotransposition indicator cassette is depicted at the top of the Figure. Features of the plasmid are shown to scale: 5′UTR (green), ORF1 (light blue), inter-orf spacer (light gray), ORF2 (dark blue), 3′UTR (orange), NEO cassette (purple) with HSV_tk polyA signal (maroon), SV40 promoter/ori (pink), ColE1 bacterial origin of replication (red), and plasmid backbone sequence between the above mentioned features (dark gray). The name of the cell line from which each insertion was recovered is listed at the left side. The length and structural features of characterized insertions are represented graphically at the right side. The truncation point of each insertion, relative to the pJM140/L1.3/Δ2/k7 retrotransposition indicator plasmid (Gilbert et al., 2005), is depicted in black. For inversion/deletion containing insertions, the break points are depicted in black, with a double line marking the inversion/deletion junction. The inverted sequence is depicted as a left-facing arrow. Some recovered insertions ended at the restriction site used in the recovery procedure; the sites are named in red lettering (e.g., see insertion B1-10). Nucleotide changes from the pJM140/L1.3/Δ2/k7 sequence are depicted as follows: stars indicate G-to-A changes; circles indicate any other nucleotide change. Blue shapes indicate changes in non-coding regions; green shapes indicate silent mutations; yellow shapes indicate missense mutations; red shapes indicate nonsense mutations.

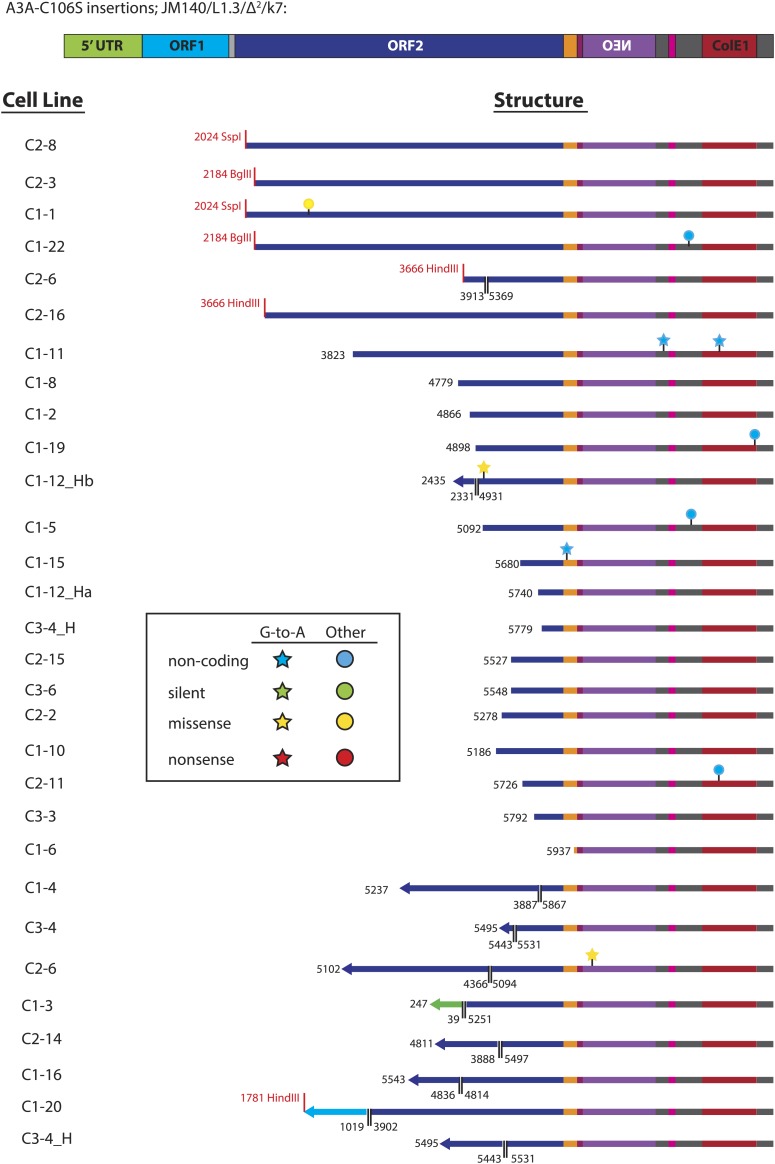
Figure 3—figure supplement 3. Summary of L1 retrotransposition events generated in U2OS_UGI cells in the presence of A3A_C106S.

Figure 3—figure supplement 3.

Insertion features and nucleotide changes are depicted as described in Figure 3—figure supplement 2.

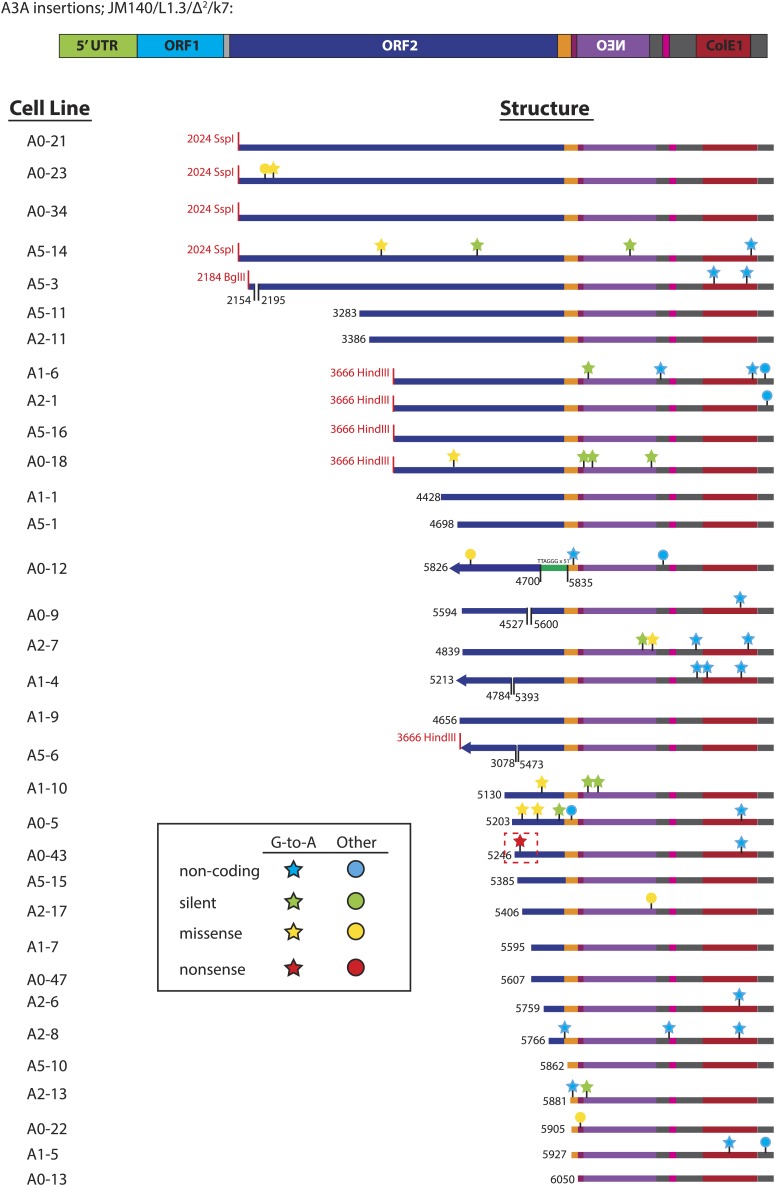
Figure 3—figure supplement 4. Summary of L1 retrotransposition events generated in U2OS_UGI cells in the presence of A3A.

Figure 3—figure supplement 4.

Insertion features and nucleotide changes are depicted as described in Figure 3—figure supplement 2. The nonsense mutation G-5390-A recovered from cell line A0-43 is highlighted with a dotted red box. 51 copies of a TTAGGG telomeric repeat, highlighted by the green rectangle, were captured at the inversion/deletion junction of A0-12.

Figure 3—figure supplement 5. The L1.3 G-5390-A mutation decreases L1 retrotransposition efficiency.

Figure 3—figure supplement 5.

The G-5390-A mutation was generated by site-directed mutagenesis on wild-type pJM101/L1.3. U2OS_UGI cells were transfected with 1 μg of retrotransposition indicator plasmid. (A) Representative retrotransposition assays: from left, wells contain pJM101/L1.3 (wild type), pDK135 (RT-deficient mutant), pJM101/L1.3/G-5390-A, and an untransfected control. (B) Quantification of retrotransposition efficiencies: the x-axis shows the elements used in the assay. RT- indicates the RT-deficient mutant negative control pDK135. The y-axis indicates the percent of retrotransposition relative to the pJM101/L1.3 control. Data are shown as the mean percent retrotransposition derived from two independent experiments consisting of three technical replicates each, with error bars representing the standard deviation among all six technical replicates.