Figure 7.

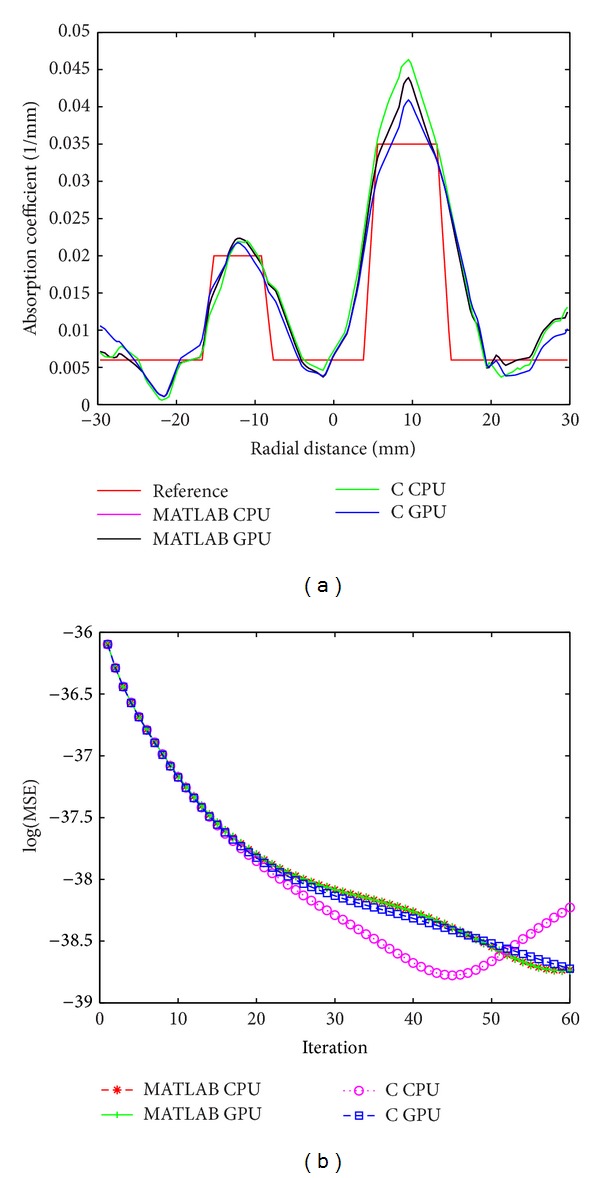
For experimental phantom, (a) cross-sectional line through the center of inhomogeneities 1 and 2 and (b) MSE between computed measurements and the experimental measurement data as iteration proceeds (M C and M E).

For experimental phantom, (a) cross-sectional line through the center of inhomogeneities 1 and 2 and (b) MSE between computed measurements and the experimental measurement data as iteration proceeds (M C and M E).