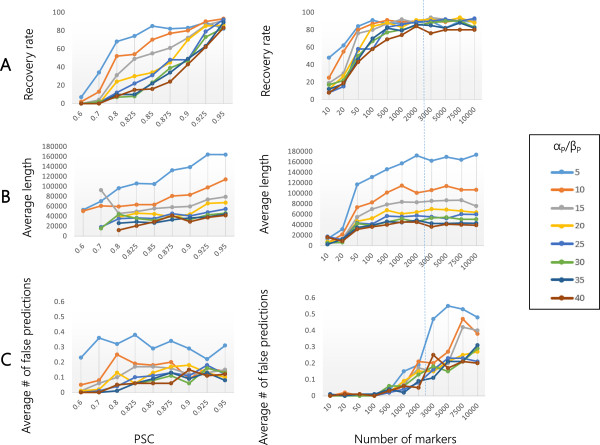
Figure 4.
Effect of αP/βP on the performance of EXPLoRA. The recovery rate (panel A), average size of the linked region (panel B) and number of falsely predicted regions (Panel C) as a function of the noise level represented by the ratio of the segregants in the pool that have the causal allele versus those that have not (PSC) (left sided plots) and the number of marker sites (right sided plots). Results obtained with a number of markers that occur in real experimental settings are indicated with a dotted line.

