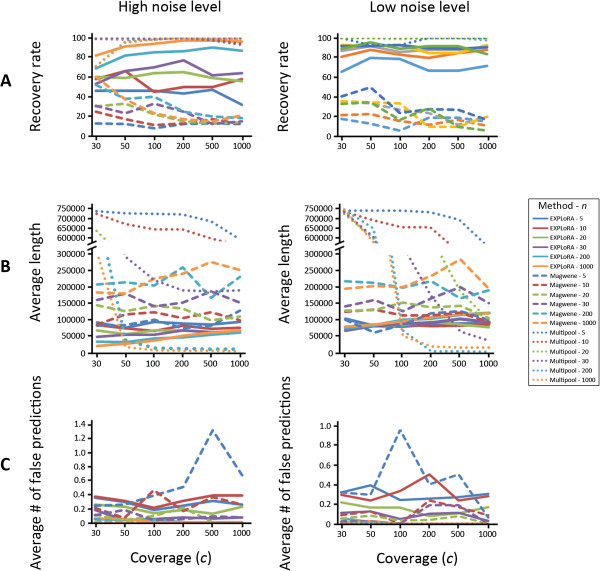
Figure 5.
Comparison with the state-of-the-art. The recovery rate (panel A), average size of the linked region (panel B) and number of falsely predicted regions (Panel C) under high (left sided plots) and low (right sided plots) noise levels were assessed for EXPLoRA the method of Magwene et al. and MULTIPOOL. In the plots of panel B (average size of the linked region) the y-axis was split into two scales to facilitate showing the results of MULTIPOOL without compressing the curves obtained by EXPLoRA and the method of Magwene et al.

