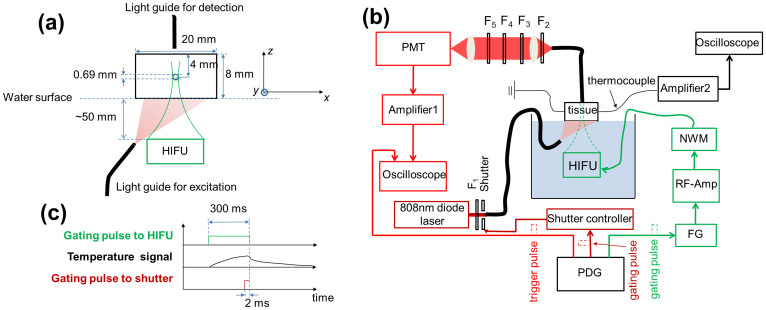
Figure 2.
(a) The sample configuration, including the tissue, the tube, the excitation and emission fiber bundles, and the HIFU transducer. (b) The schematic diagram of the USF imaging system. PDG: pulse delay generator; FG: function generator; RF-Amp: radio-frequency power amplifier; MNW: matching network; HIFU: high intensity focused ultrasound; Amplifier 1: low noise current preamplifier; PMT: photomultiplier tube; F1: excitation filter; F2–F5: emission filters; Amplifier 2: an amplifier circuit consisting mainly of a high-precision operational amplifier OPA2277. (c) The timing diagram showing the gating pulse to the HIFU transducer and the shutter. The gating pulse to the HIFU determined the heating period (300 ms in this study). During the heating period, the temperature in the focal volume increased continuously. At the final 2 ms of this duration, the shutter was opened to excite the fluorescence signal. At the same time, the oscilloscope was triggered for data acquisition.

