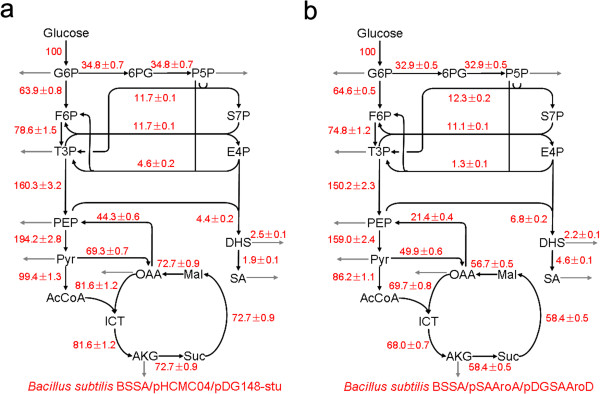
Figure 3.

Metabolic flux distribution in B. subtilis BSSA/pHCMC04/pDG148-stu (a) and BSSA/pSAAroA/pDGSAAroD (b) during exponential growth phase. The estimated net fluxes were percentages of the relative rates normalized to the glucose uptake rates. Directions of net fluxes were represented by arrows. The gray arrows indicated flux related to biomass formation and fermentation products. The flux distributions were obtained from the best fit to the quantitative physiological data and the constraints derived from the MS measurements. F6P, fructose-6-phosphate; GAP, Glyceraldehyde 3-phosphate; AcCoA, acetyl-CoA; ICT, isocitrate; AKG, a-ketoglutarate; S7P, sedoheptulose-7-phosphate; DHS, 3-dehydroshikimic acid; SA, shikimic acid.
